Hi.
When opening an app built using Wappler with AppConnect framework, based on complexity of the application, the task manager shows a particular memory usage number.
For the app in question right now, it starts at 240MB.
While the user uses the application, it gradually keeps increasing… and within 30-60min, it can climb to a GB, and sometimes even faster.
I tried running performance and memory reports in the inspector tools, but I wasn’t able to make much sense of it. We already use conditional regions to ensure the UI remains light, and there are not too many active bindings on the page.
If anyone can help with reading these reports or some other way to identify what the problem is, it would be great.
I am on 5.8.2 stable channel.
I have multiple such Wappler applications, where I can see the same behaviour, so its most definitely a Wappler issue, but not sure if its because I have configured something incorrectly, or there is some problem with AppConnect.
And this is not new either. It has been so for about 3 years now, as far as I can recollect.
But because the number of users and active-time across all applications were low, it was never a concern. With time, we are now at a stage where the both number of active users and usage have increased and have started receiving complaints because of it.
When using the memory tool you create 2 Snapshots and compare them to see which objects are added, but it is difficult to figure out the exact memory leak if you don’t know what to watch for.
The performance tool is easier to use, you record a while when doing actions in your app and then can check in the timeline where memory increases (make sure you have checked it on before recording) and look at which JavaScript code was run at that moment.
It is difficult for me to say where to look without knowing more about the app and finding a memory leak is always a difficult task.
Thanks for the reply.
I was reading up a bit more about “memory leak” (this term scares me!), and turns out, it could also be because of 3rd party JS plugins/libraries I might have… or just some custom JS code around events.
Will be investigating further and post my findings here.
I will check with my client to see if I can give you access to production environment, in case you have time to look.
It seems to only happen in Chrome, and not Firefox. It started happening in the last 3-4 weeks and never happened before. I’ve gone back to versions of my app where this was never a problem, but those versions have this issue too in Chrome.
I really need to find a fix too.
My app is based on Wappler 3.9.7.
The some issue occurs on my test site based on 6.0 beta.
@patrick, would really appreciate your support in this. I think there is some part of App Connect that Chrome has taken a dislike to. Can you help us find it and work with Google to find a solution?
The old App Connect 1 had a bad memory model and manual way of keeping data changes that could result in bad performance in large apps.
That is why we build the whole new App Connect 2 with a brand new model and using smart signals for triggering only data changes of data that is really changed. So much more reactive and responsive.
I suggest that you switch to App Connect 2 and see how your app perform there.
App Connect 2 is fully stable now and we are just keeping it in beta while finalizing the last components that need an update.
We will soon be releasing App Connect 2 and that means that App Connect 1 will be deprecated then and no longer supported.
Are your Projects both PHP? We don’t seem to have any of these issues with Node, and we are running some quite hefty applications, with lots going on in the front and back end respectfully. Memory usage remains stable across the board.
Well the only explanation that I can think of is that there is too much data loaded client side for example from many server connects while the data is not always needed but once loaded, specially with the old app connect, it is constantly parsed for changes. But still that shouldn’t result in higher memory usage.
We make use of no load on a lot of our Actions and only call for the data when a User requires it. Either via an interaction or triggering a load event within a Flow for example (with a wait period). We rarely require all records from a query so simply request what we need, or to be more precise what the User wants to see. We have found this method accelerates response significantly (and obviously as not pulling tens of thousands of rows of data). This correlates with your answer and explains it. Cheers George was interested to know!
Thanks for your thoughts… here is a bit more information to help us move this forwards…
I am seeing exactly the same issue with my 6.0 beta version of the app which uses AC2, so this is not an AC1 versus AC2 issue.
It only started happening in the last month.
It is nothing to do with anything I recently added to my app as I get the same issue with a previous version of my app where this didn’t use to happen.
Once my app has been used for a short while, the memory usage goes from a few hundreds of Mb to 2+Gb over 5-15 minutes with no user interaction and no activity in the network tab of the developer tools.
It is specific only to Chrome.
It is a PHP project.
I hope this helps you and @patrick to be able to find a way to work with us to find a solution.
Hi.
Being a client side issue, server side model does not really matter here.
Mine is NodeJS.
As George has pointed out, when there are too many bindings in the UI, things start to slow down. And this is something we had identified few years ago, which lead to us optimizing every dynamic binding we have on client side. Unfortunately, there is no defined capacity/limit with AC1, so there is no way to really know when the app will break.
But again, that is not the core problem here. Its that RAM usage increases, without any change in the bindings on page, since the user is on the same page while this happens.
I am a bit surprised from Antony’s findings that AC2 is no better - but will have to check myself. Unfortunately, all our active projects are in production for many months/years now, so we haven’t been able to test out any beta stuff lately.
Another interesting observation is that its Chrome specific. So have to validate that too.
As guided by Patrick, I am yet to compare the reports from dev tools. But hopefully tomorrow.
I suspect my custom JS code & integrations might be adding to some existing AC1 issue.
@George how many server connects on a page would be too many…? I suppose it would depend on what data was being returned, but as a rough idea, how many are we looking at?
@Antony you said Chrome specific but how does it run on MS Edge? Do you get the same issue? I say this as Edge uses Chrome internals for most of its functionality, if you don’t get the issue in Edge, that could possibly pinpoint where in Chrome is triggering it. All you’d need to do is find out what the differences are between those two browsers.
Well it depends indeed on the data they return. So hundreds of server connect actions with each returning tens of thousands records might get too much if all running on a single page.
That is why division of your complex app in multiple pages with only the functionality they need is a wise way to go.
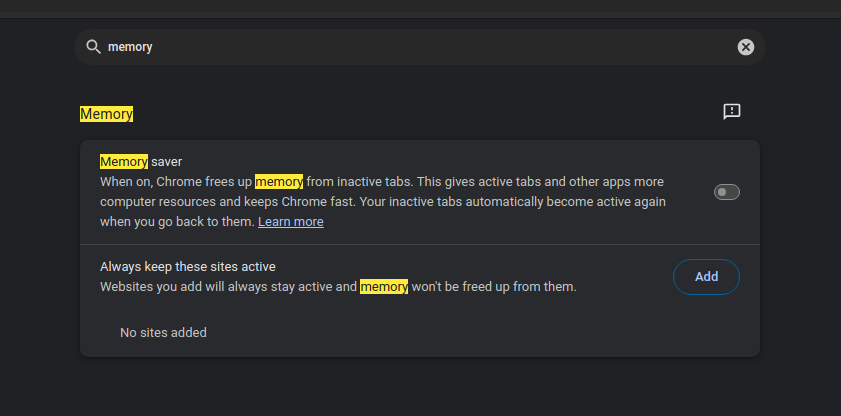
Just a thought, and being that its Chrome based, what happens if you turn off Memory Saver in the settings? Or vice-versa, if it is disabled then try enabling it?
Personally I disabled it as have no issues and besides I don’t know if it makes that much of a difference… Also I like to be in control of what my memory is doing and don’t want a browser controlling it.
Anyway… The above is just a brain-fart moment. Anything worth a shot I suppose!
@patrick I ran the memory tool multiple times and captured 4 snapshots - each a few MBs more than the last… while being on the same page, and just changing the selected element in list.
The app is in simple terms a real-time chat-ui. Clicking on a item in the list, fetches the latest messages from server, and shows them in a div besides the list. There are live messages being delivered over web-socket, which update the list and messages UI.
Unfortunately, I could not make sense of the snapshots. I tried doing a comparison as well.
I can share the snapshots with you, it you have time and will be able to make sense of it.
@patrick I ran another memory leak tool called memlab from Facebook, and the results there are also unreadable.
Everything in the output, from both dev tools and memlab just say dmxComponent or object or something of that sort which does not make any sense.
Only you can help read this.
The high usage is causing a very poor UX and lots of user complaints. Need to fix it urgently.
Please reply.