A post was split to a new topic: Memory usage on a web app
You are still using App Connect 1, have you tested with replacing it with App Connect 2 (beta) to see if then the memory issue is resolved. The Components that are already updated to App Connect 2 do dispose better when destroyed, the life cycle is a bit different there. I think the memory increase is mainly when navigating or toggling conditional regions since then previous components are being destroyed (probably leafing some references in memory) and new ones are created. Can you confirm this or is there also memory leak when you are idle on the page?
Because there are sockets, there is no actual idle scenario. Messages are coming in every few seconds.
I tested it on dev where there was no activity, and there were 0 leaks in that case.
I have not yet updated to Wappler 6. Will try to check it over the weekend by upgrading and switching to Beta channel.
For the problem at hand right now, can you share some help on AC1 results?
Because even if AC2 is released, it won’t be production ready immediately. So need a solution with AC1.
We first have to pinpoint when the memory leak happens, is this when navigating or updating specific parts of the page. Memory leaks are normally left-overs after elements are removed and not all references are cleared which keeps the Garbage Collection from freeing them from memory.
I did not know much about memory leaks until this, and have been trying to understand what it is since then.
memlab had good examples and text, so I was able to understand it to some extent.
The application here is an SPA, which has a real-time inbox working via Sockets and Redis.
Based on sockets, we update UI - some via JS and some via Wappler’s bindings.
I checked all the JS code, and there are no leaks there.
When I am on this page on production, and do nothing - just with the new sockets coming in, the items in the list move around because of dynamic repeat, causing memory leaks.
Additionally, the user clicks on items in list to view details, and this detail view also shows/hides when switching between items from the list, adding to the memory leaks.
What I am assuming here is that AC1 is keeping references to HTML elements, to be able to update it dynamically, but when its removed from the UI, its not cleanly disposing those references.
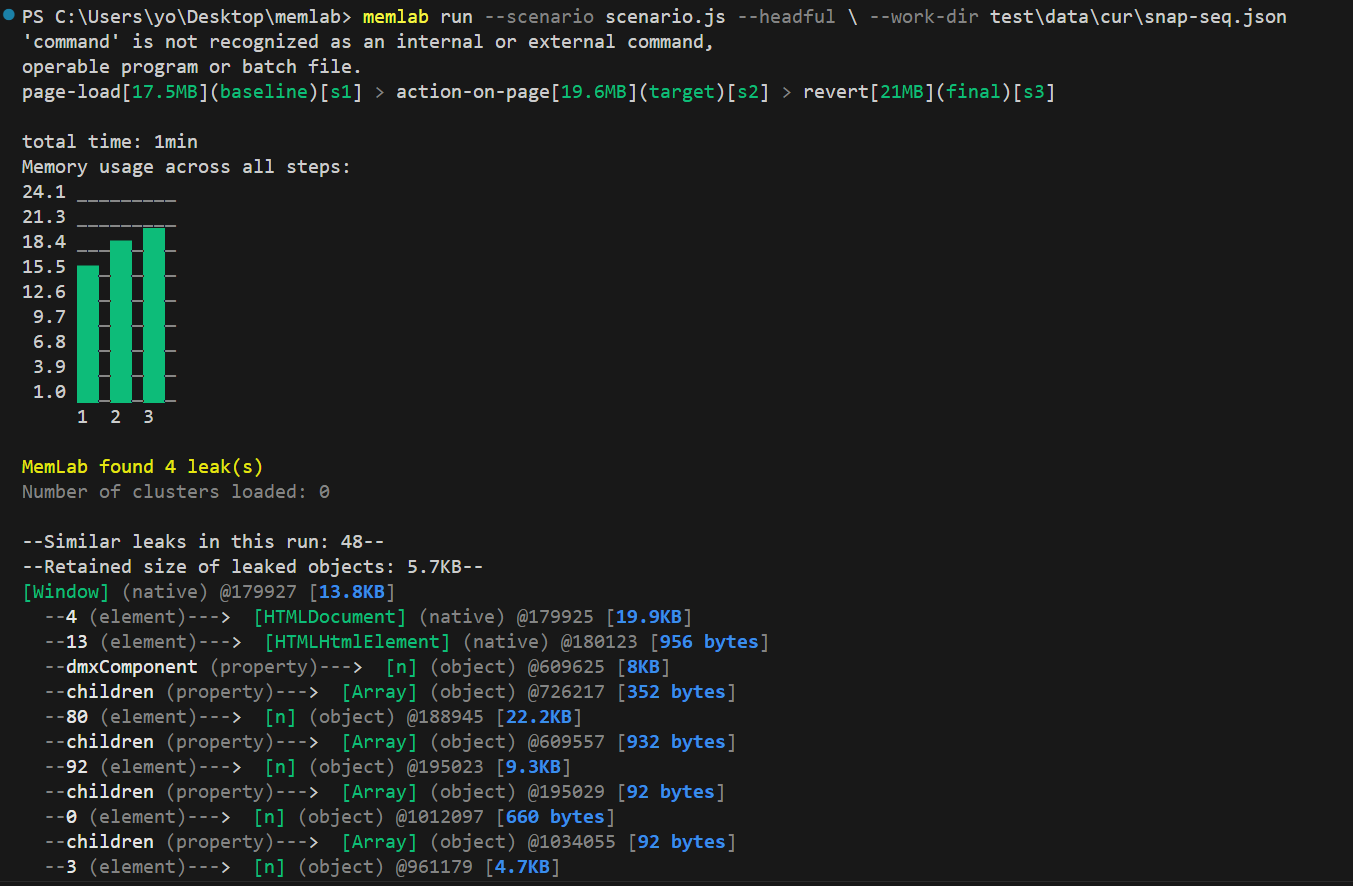
Here’s a report from memlab on this page, which mentions dmxComponent, and rest are just numbered elements, which I am assuming are how they are created by AC1.
This design is extremely similar to mine. Although, I don’t even click into the detail view of the items and the memory increases. I’ll try to use memlab and provide details once I finish the switch from pouchdb to SQLite.
@patrick
Upgraded Wappler to 6.0.2, switched experimental on, switched to beta channel, force updated all project files and then ran the app.
The memory leaks still exist.
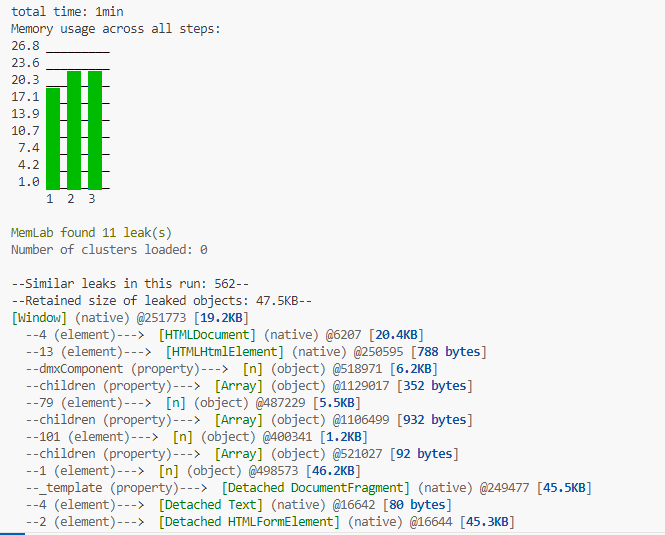
5.8.2 with AC1 gave 4 leaks in the same test, while 6.0.2 with AC2 returned 11 leaks. Although the size of memory heap was similar.
@George For the application in question here, I could not actually see any UI speed improvements in the brief testing that I have done.
Could be because we already have done many optimizations from our learnings over the years… or probably need to see it in action in production.
1 Like
@sid, my UI is definitely faster in AC2, but there was no difference with the memory leak…
1 Like
On a large project I updated to AC2 I don’t notice a lot of difference. But I am currently rebuilding that project from scratch with AC2 and it’s lightning fast comparatively. No memory leaks though … all is good there.
1 Like
I try to find the objects that aren’t freed from memory, but it can take a while to identify them. Expect improvements in future updates.
AC2 should be faster in most cases, but there are also some cases where it can be slower. When you do a lot of updates to the data and also have that data as bindings in the DOM it can slow down your App since it will update the DOM directly with any data change. Any data change now directly updates all its dependencies while in previous AC some dependencies were updated in a next cycle which causes data not being up-to-date for a small moment and users started adding delays to specific actions since a value was not yet updated after some events.
We have optimized the dynamic bindings a lot over the years, and our process makes sure there are not too many on the page at any given time.
So will keep the DOM thing in mind when AC2 releases… as we are using delays in current setup in numerous places, where there was no other option.