… and while you are looking at this one @patrick, I’d really appreciate you looking at my issue too as they could well be related, and my client complaints are growing as well…
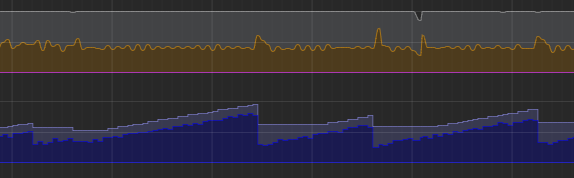
Didn’t notice a big increase in memory, I noticed with the Performance monitor that the JS heap size goes from 50MB to 100MB and then back again. After inspecting this behavior I found that the only thing running is the scheduler, it takes a while for the Garbage Collection to clean up memory again. Also noticed that the CPU is relative high while being idle on the page, this again is due to the scheduler.
Yellow is the CPU usage and blue is the Memory usage.
The above was when checking the AC1 version of the app.
You can enable the Performance monitor in devtools to see real-time CPU/Memory usage of your page.
I noticed that you have an old scheduler version on that page, your version is 1.0.0 while latest stable is version 1.1.0. The latest version has an property noprogress which prevents it from updating each frame and should decrease the CPU usage and probably also some Memory.
Yes, I was thinking that too @brad… it turned out the way I was doing it I had just randomly put there and found it worked okay so not changed it until Chrome decided it didn’t like it any more!