I’m trying to figure this out. Seems like it could be due to adding records into pouchdb/indexeddb. If 100 records are added in one go, from API calls, then the memory starts to increase from ~600MB to ~2GB and doesn’t stop increasing, even after all of the records are added. Then, when I refresh the page it drops immediately down to a more stable ~1GB, but it appears to go back up if more records are added again, so it’s like something isn’t getting released/cleaned up after adding the records to pouchdb.
I’m not able to reproduce this, so can’t say what it could be. Does the memory increase even when not interacting with the app? Can you add <script>dmx.debug = true;</script> somewhere at the top of the page.
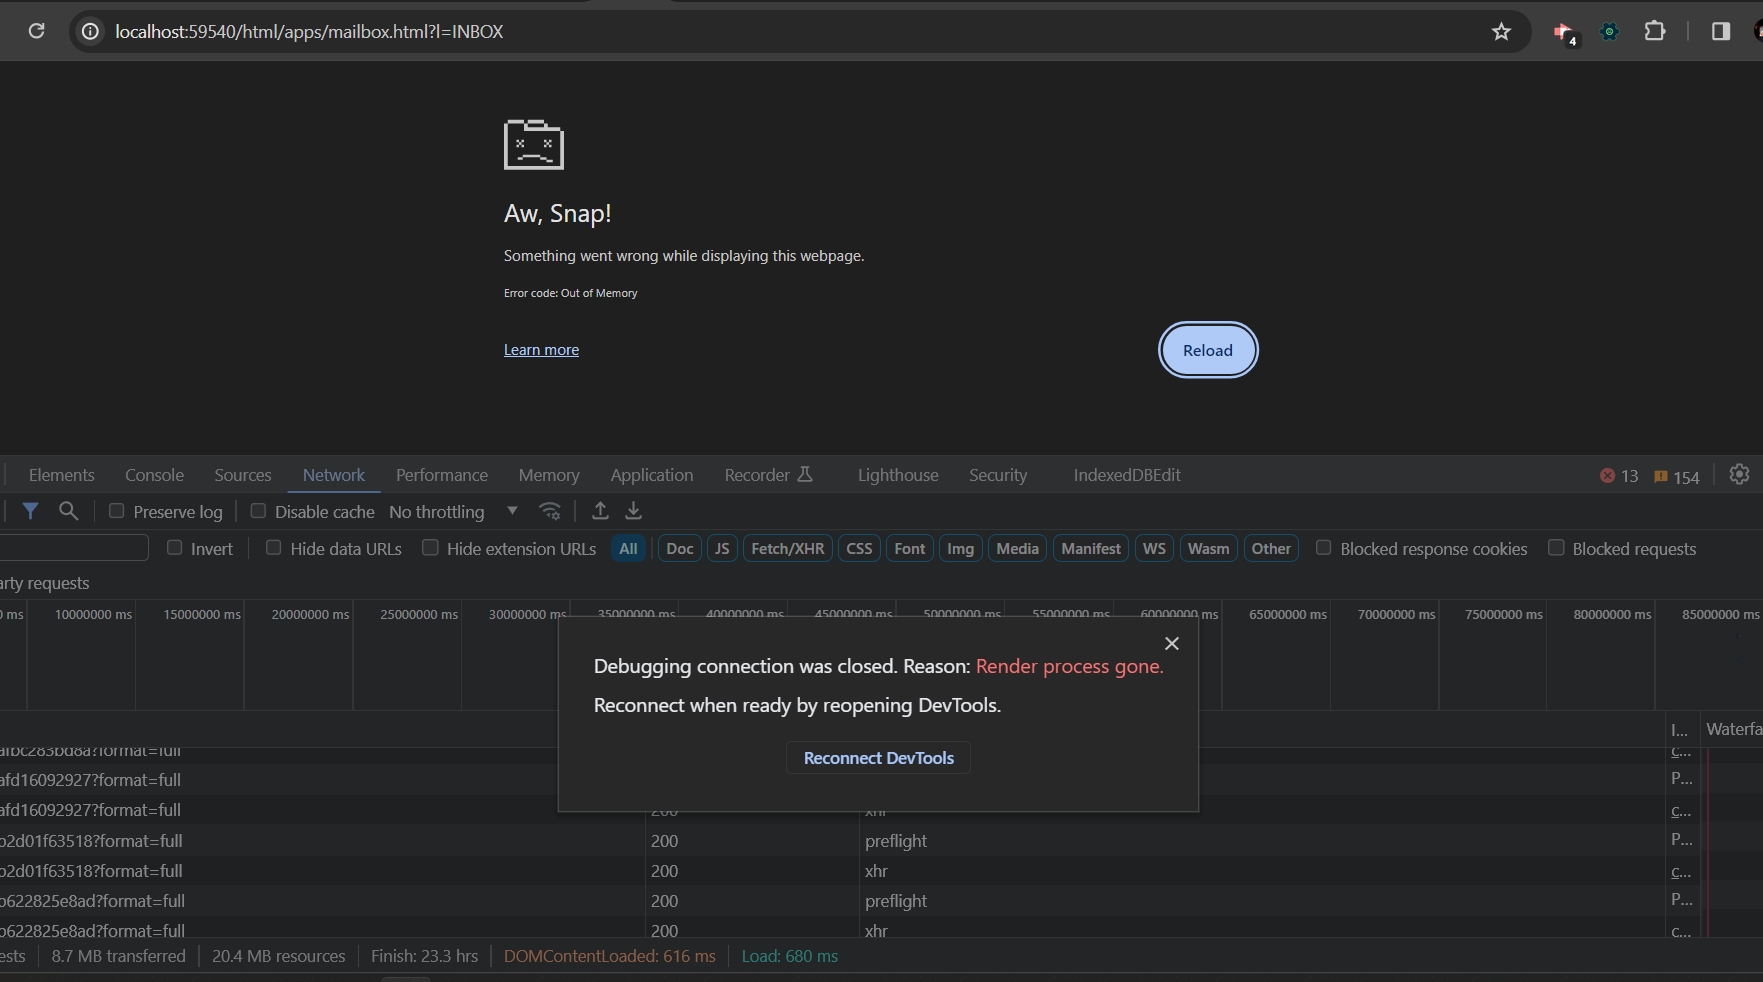
Yes, the memory continued to increase when not using it. I had an action scheduler running that was triggering an API to check for new messages every minute, so while I wasn’t interacting with the app directly it was still running some actions. Regardless, I feel like 2GB-6GB of memory for a chrome tab is way too much. I am building a somewhat complex app, so it’s possible I’m hitting some edge case.
I’m in the process of updating my app code from pouch to sqlite to see if it makes a difference, so I won’t be able to provide further analysis for this bug report at the moment.