Are You Noticing Massive Memory Usage With Chrome But Not Firefox?

I have some strange things going on with my app (built on PHP) and memory.

I’ve spent the last few days trying to track down what I thought was a memory leak in my app, and I’ve just managed to conclusively prove it is happening only in Chrome, not in Firefox, and isn’t due to some change I’ve made in my app.

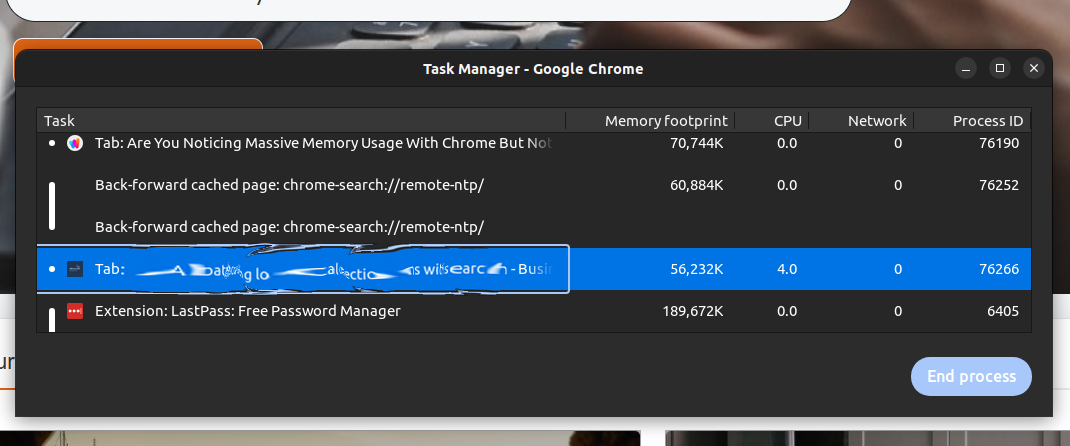
If I use my app for 5 minutes in Chrome, and then leave it static in the window, the memory usage gradually increases to 2Gb.

If I use the app in the same way in Firefox, it stays static at around 200Mb.

It seems to have started happening over the last week or so. I’ve gone back to a version of my app from 3 months ago which was super stable, and it is happening with that too. My released app is based on Wappler 3.9.7, but I have a test site running with Wappler Beta 6 and the results are similar, although Chrome is topping out at 1.2Gb rather than 2Gb.

So I’m pretty convinced it is something in my app which Chrome has stopped liking.

I’m wondering if any of you are experiencing something similar… :thinking:

And is there anything I can do about it? :man_shrugging:

Keep in mind that chrome releases new versions often so you might want to test to an earlier version.

I personally ran into this with chromium on the backend a couple months ago. A bug was rendering footers incorrectly and it took a couple weeks to fix.

1 Like

Nothing out of the ordinary. Docker/Node/Digital Ocean.

Chrome (Version 119.0.6045.159 (Official Build) (64-bit)) on Ubuntu 22.04.3 LTS.

1 Like

PHP shouldn’t have much to do with what’s happening in the browser. I ran into a memory leak as well, but I think it’s related to either the Action Scheduler or PouchDB. If I stop running them on the page, then the app stays fairly stable at 141k.

Have you tried to selectively remove components on the page to see if memory stabilizes?

Thanks for the update @kfawcett, that is really helpful.

I'm not using Pouch, and PHP doesn't have a scheduler, so I those won't effect me, but thanks for those ideas!

I spent 2 days removing newly created items from the last couple of weeks, to find nothing made a difference and that my app version from 3 months ago had the same issue...

@kfawcett, how do you get that neat little memory footprint listing?

https://community.wappler.io/uploads/default/original/3X/4/9/49722dab40c8ea8e6e7cfd318f3de1acf2362860.png

Right click in blank area at top of Chrome, then Task Manager. You can also use SHIFT + ESC.

image

You can then right click on header of table to add/remove columns.

1 Like