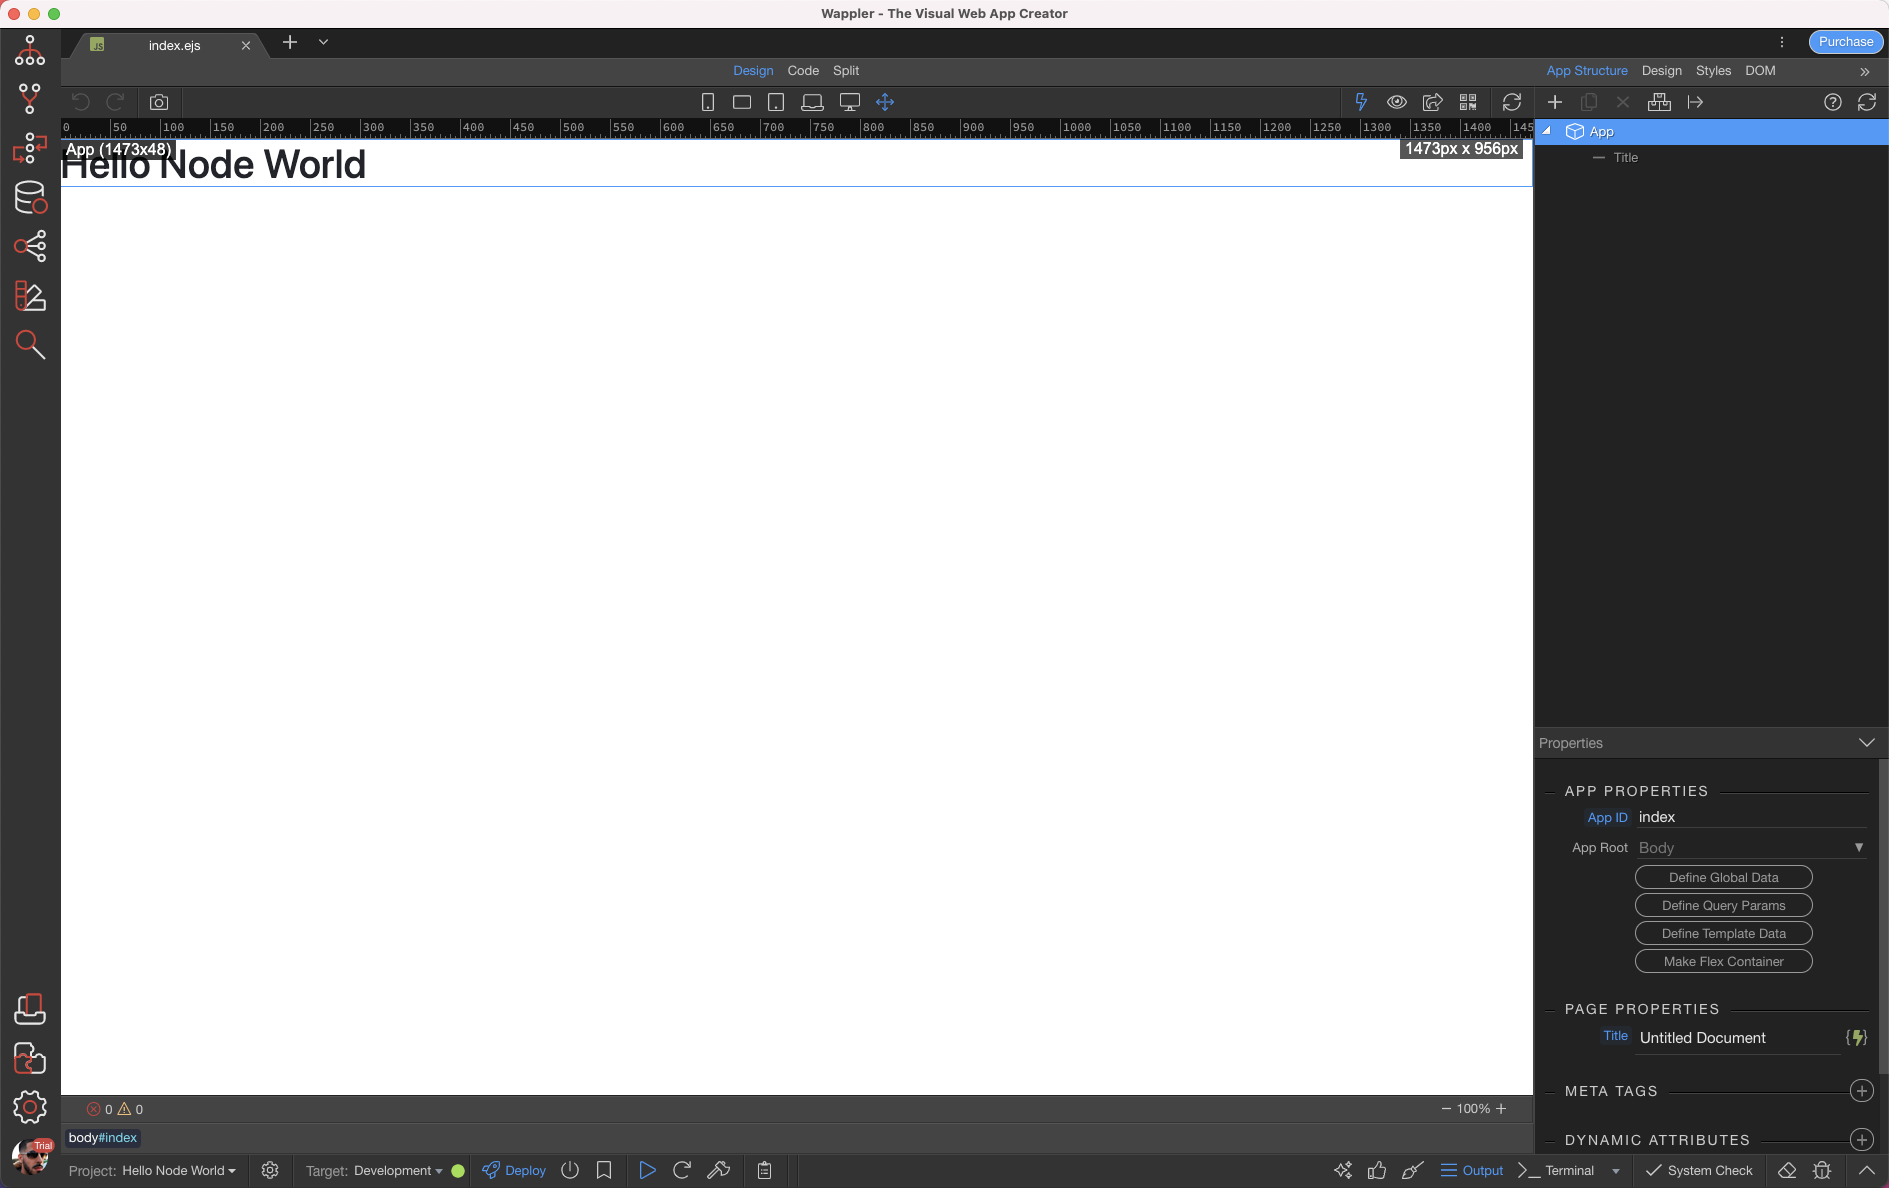
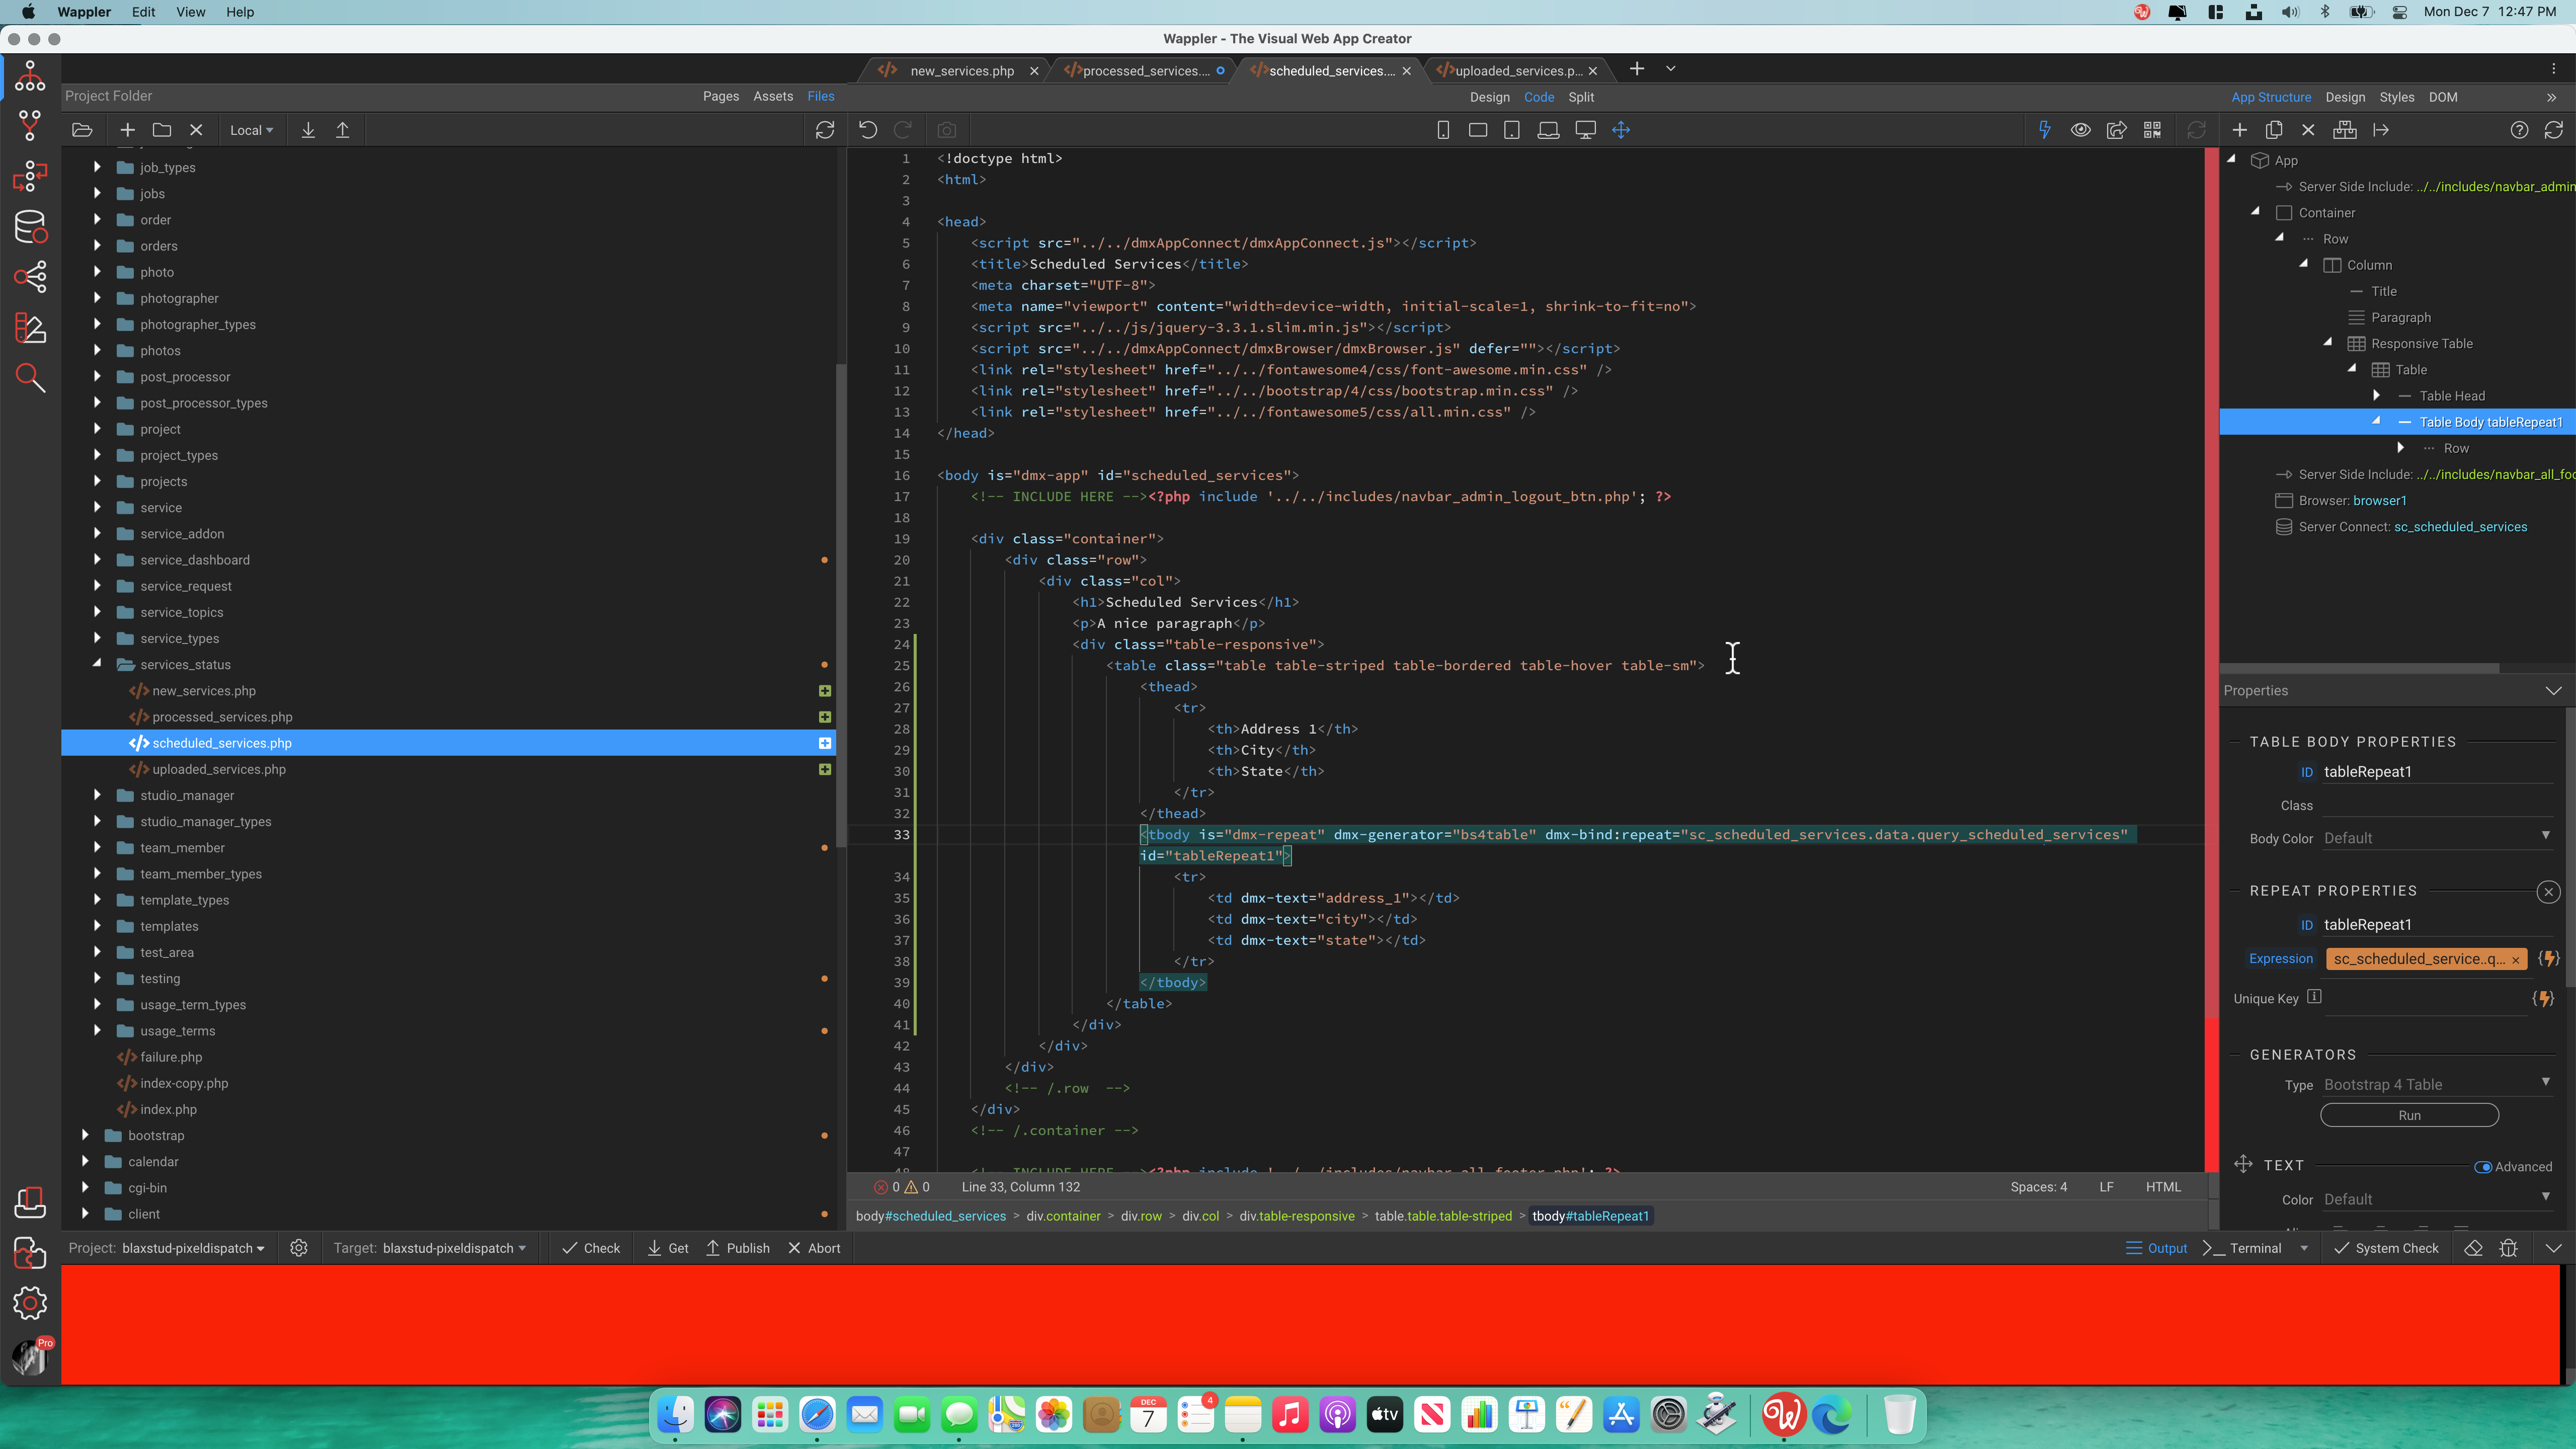
I recently downloaded Wappler to begin learning to use it. As a I shift between tabs, Wappler doesn’t respond; the only way around it is to quit Wappler and reopen it. It happens every few minutes. Is anyone experiencing similar behavior? Thank you!
macOS Big Sur 11.0.1
MacBook Pro 16" 2019
Model Identifier: MacBookPro16,1
Processor Name: 8-Core Intel Core i9
Processor Speed: 2.3 GHz
Number of Processors: 1
Total Number of Cores: 8
L2 Cache (per Core): 256 KB
L3 Cache: 16 MB
Hyper-Threading Technology: Enabled
Memory: 32 GB
System Firmware Version: 1554.50.3.0.0 (iBridge: 18.16.12561.0.0,0)
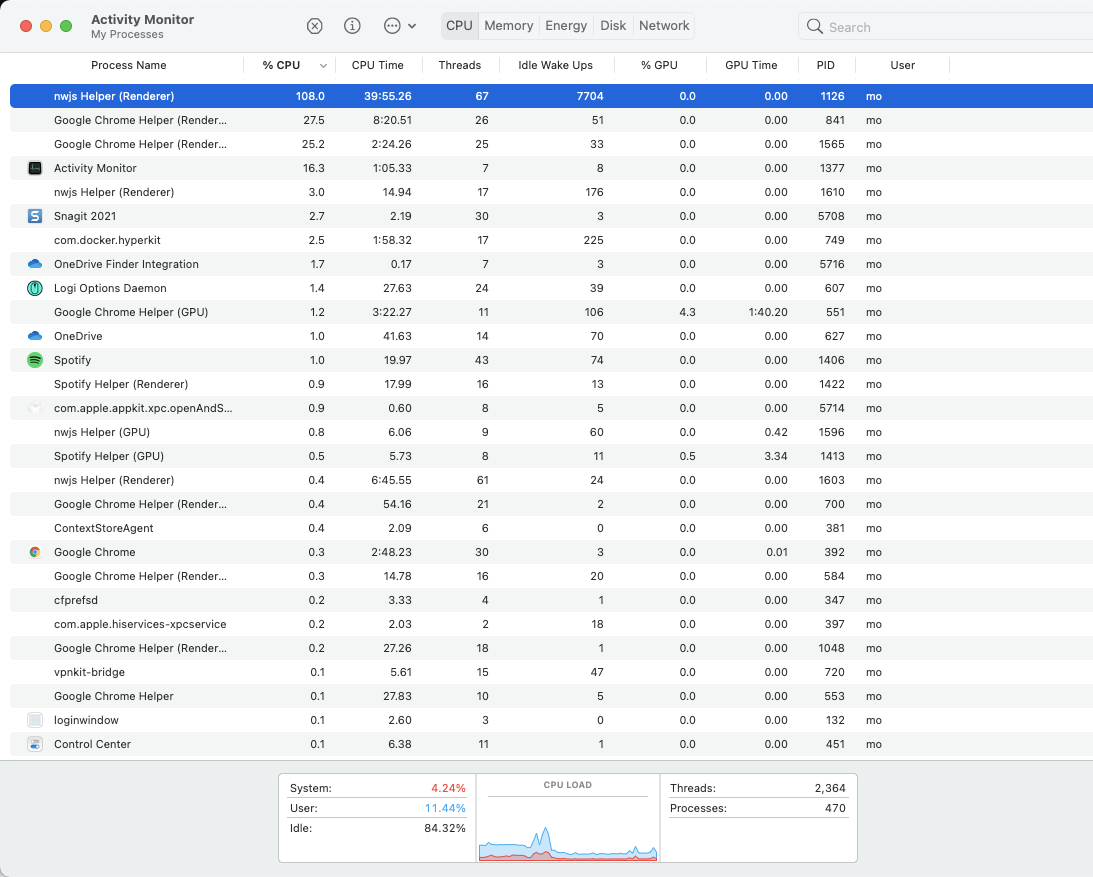
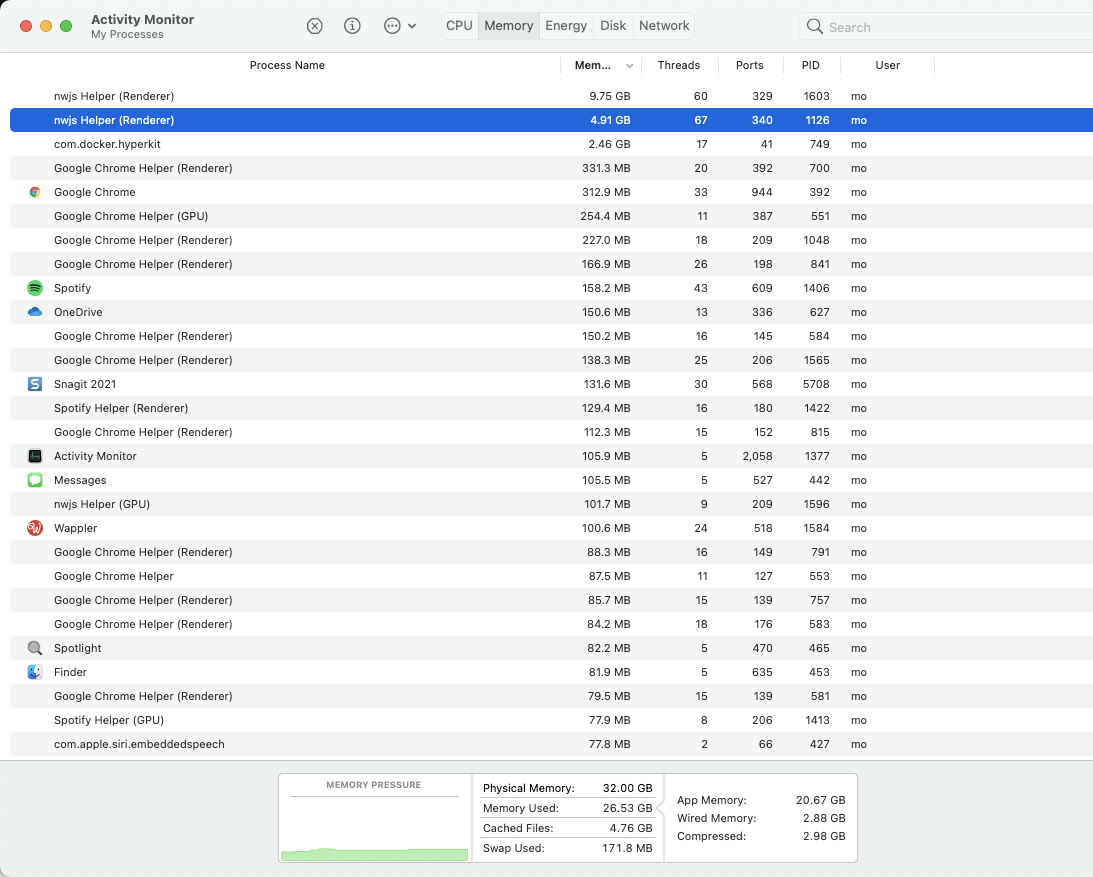
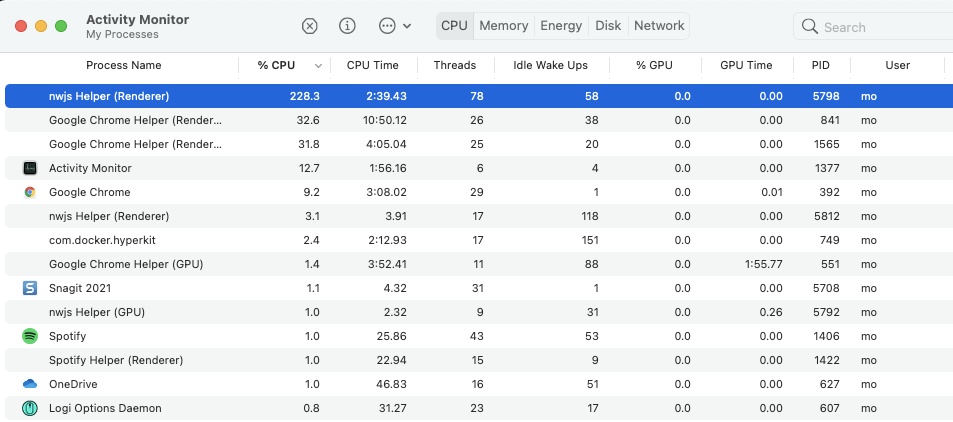
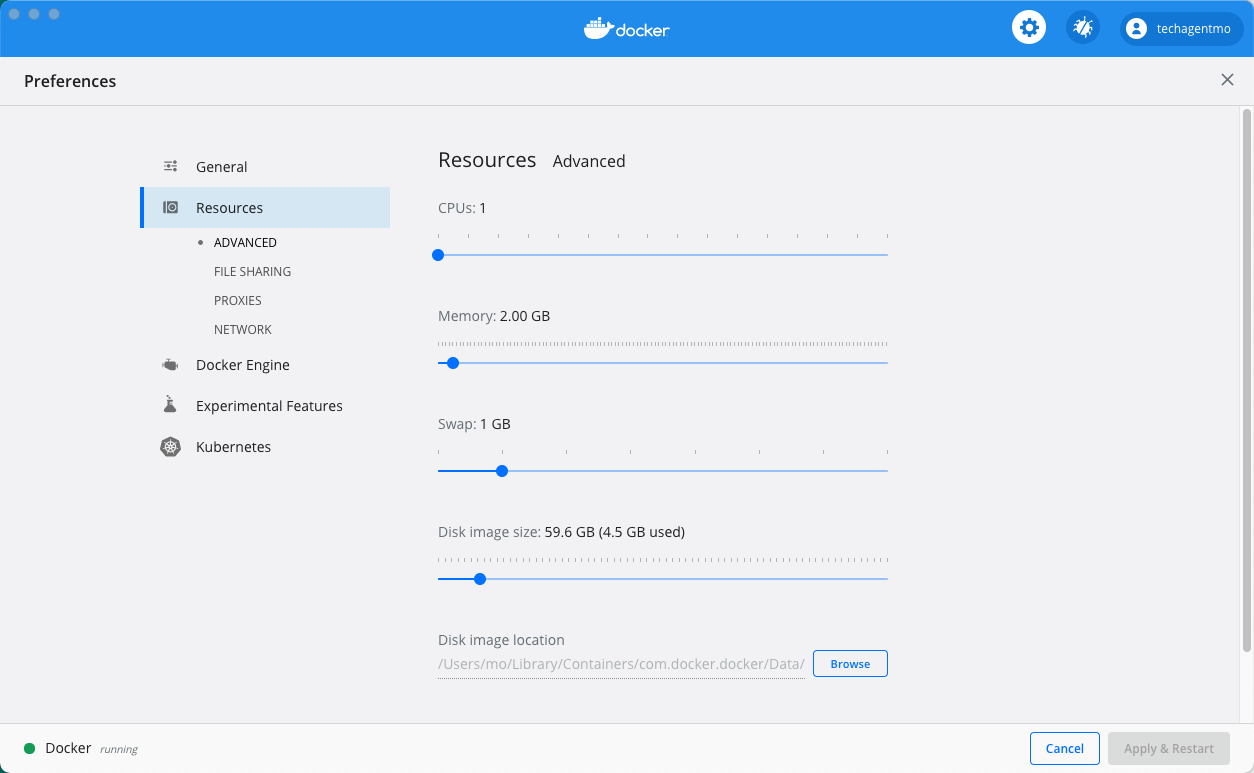
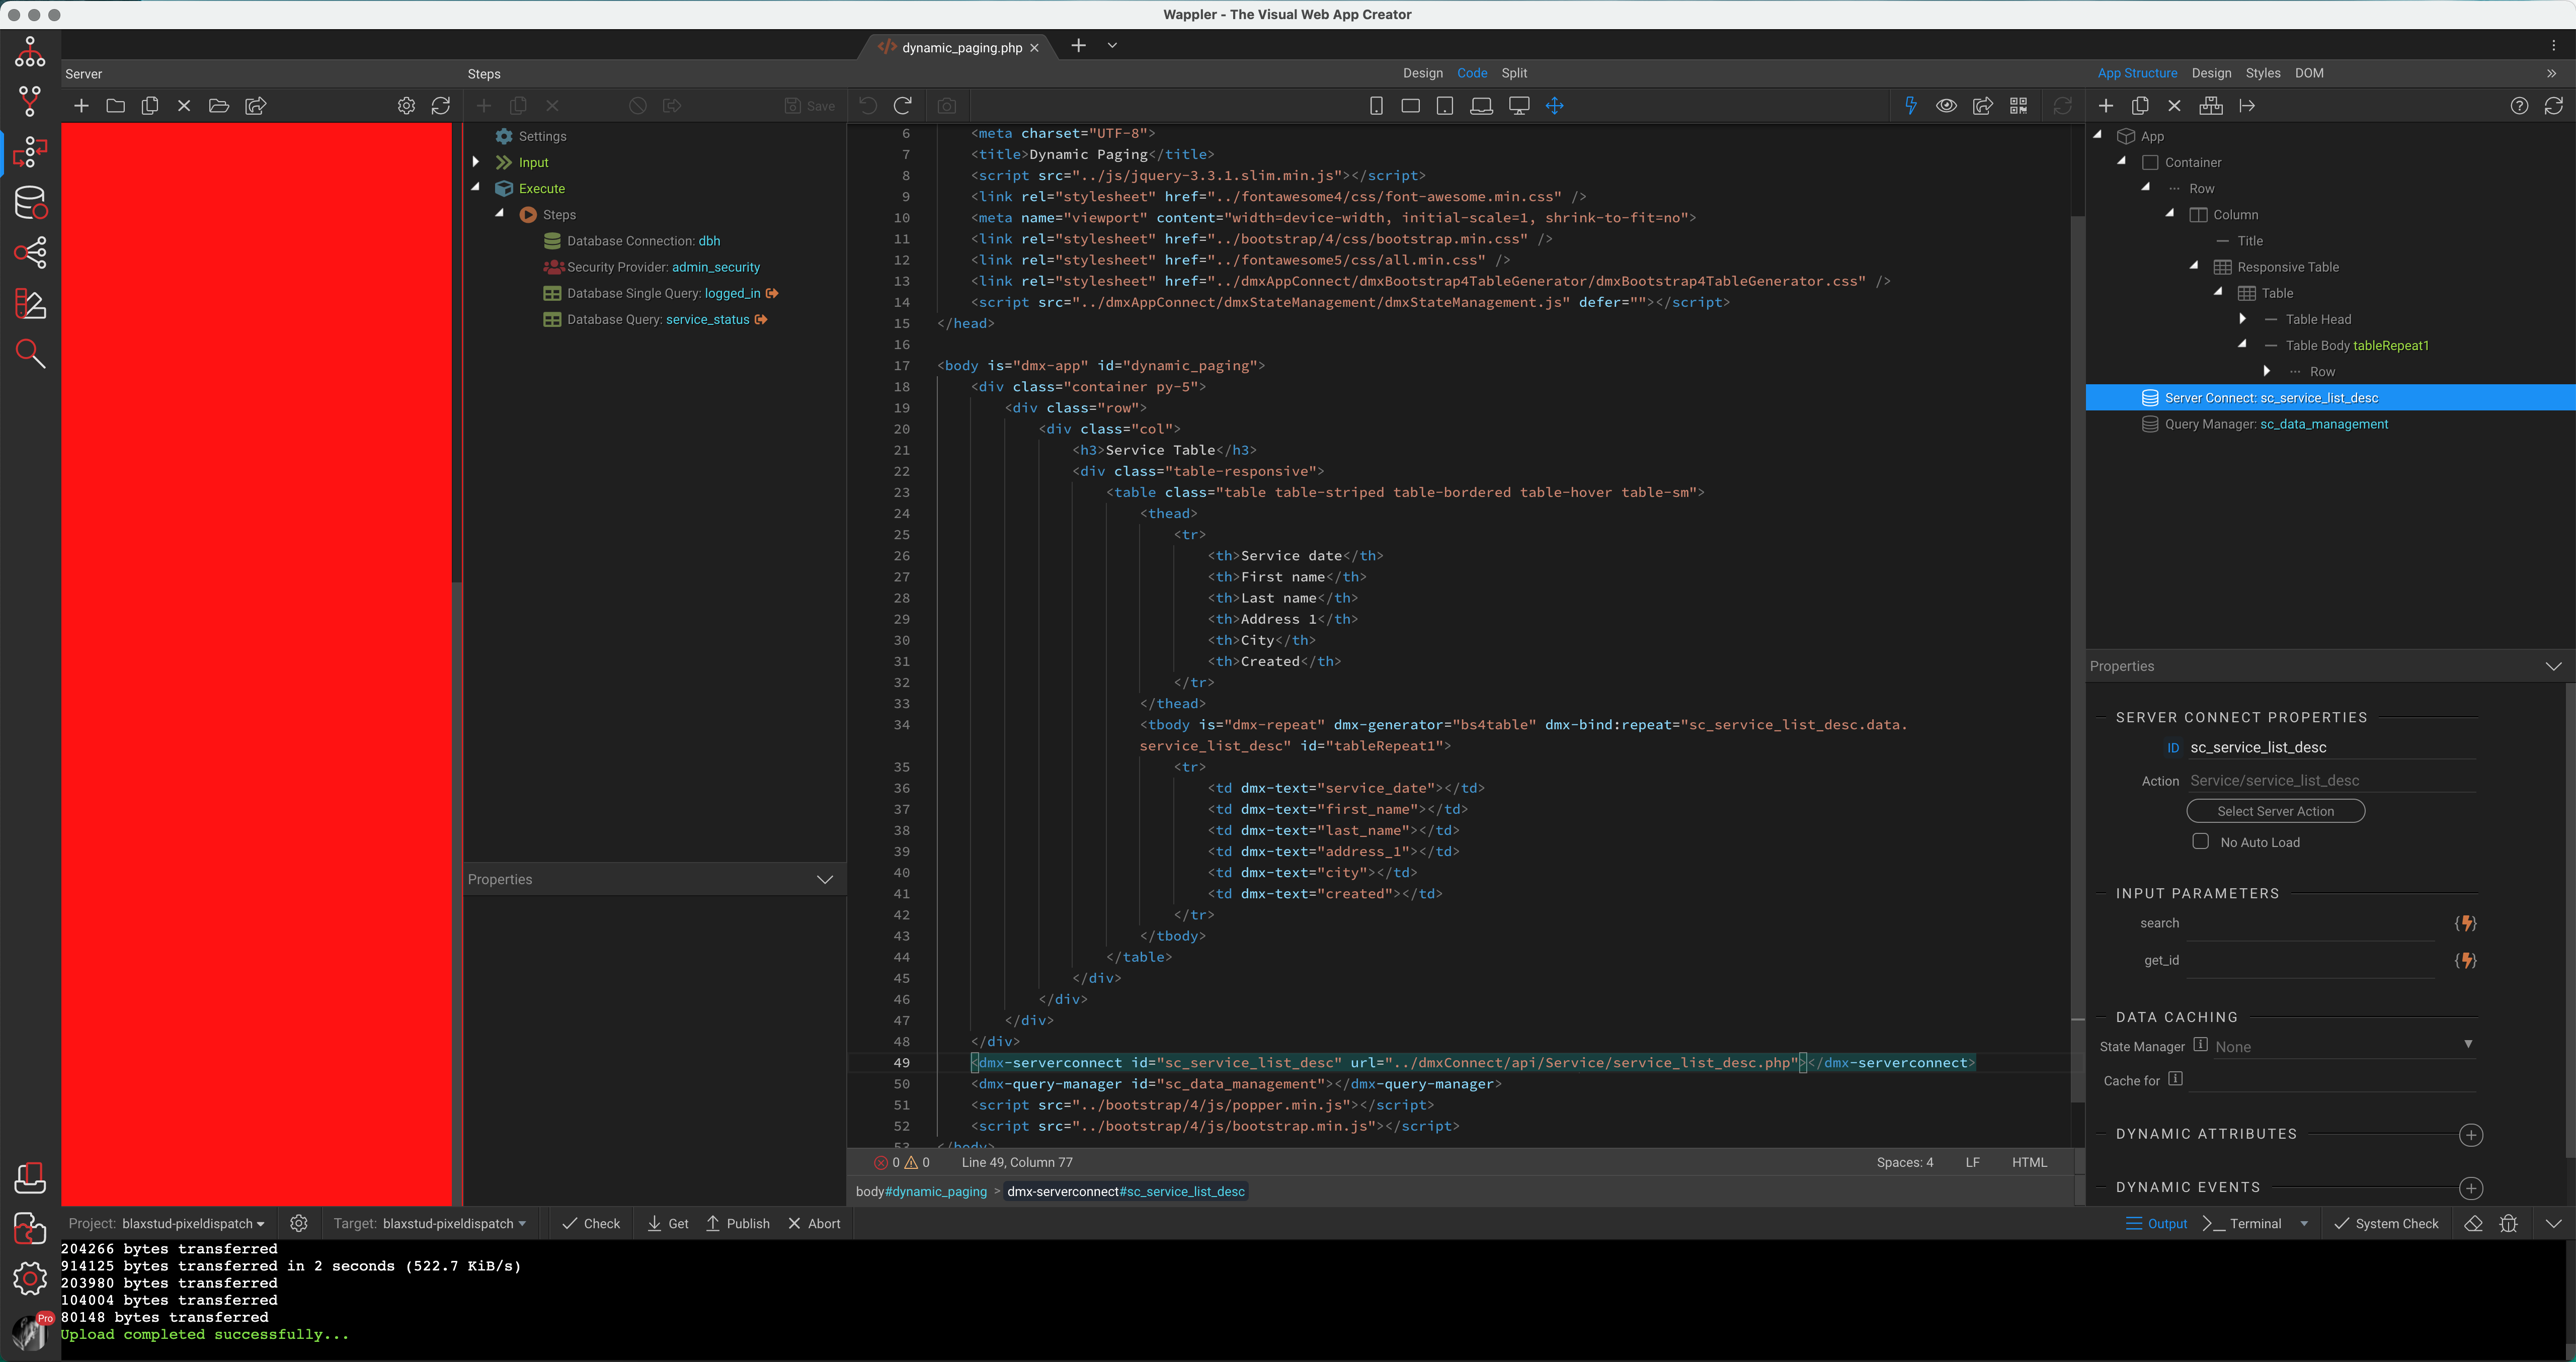
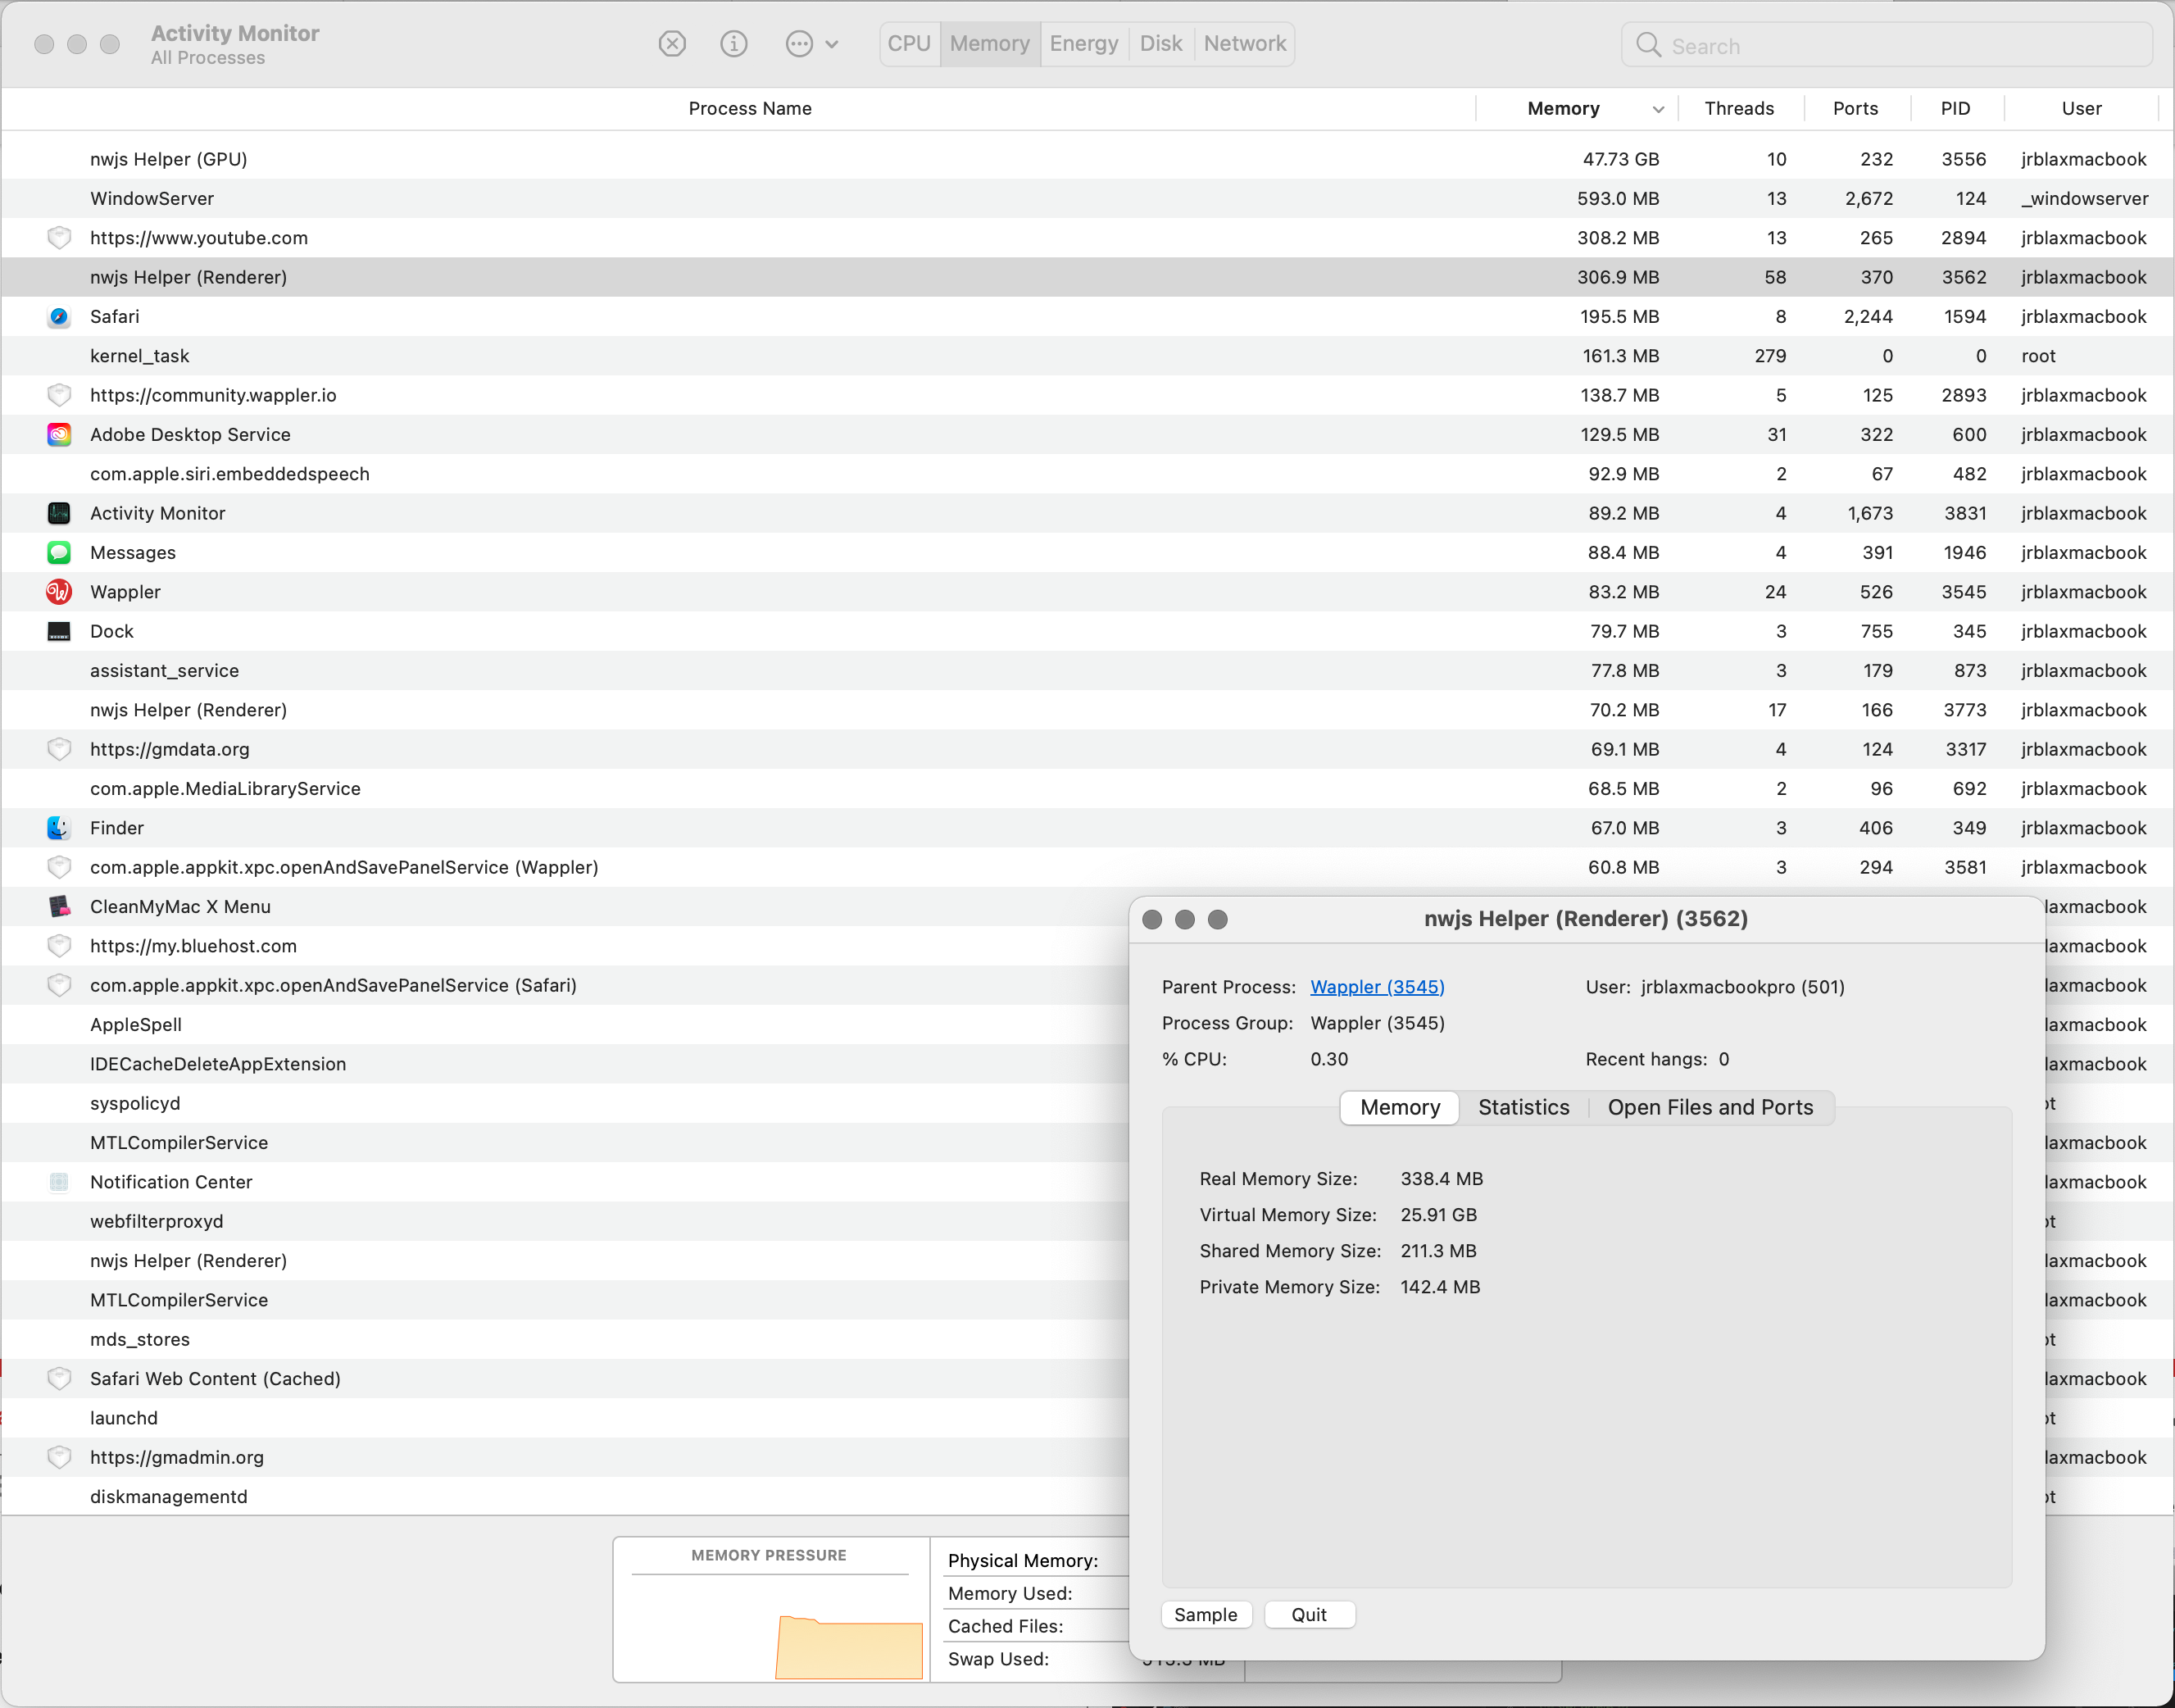
It appears to be “nwjs Helper (Renderer)” that is spiking the CPU and maintaining it. I’ve reinstalled Wappler as from a previous thread a suggestion. I ran EtreCheck for Mac to look for any possible issues but no major issues were found. This is a brand new MacBook Pro. I do have Docker installed and running with multiple monitors. Screenshots of Memory and CPU usage is below.
A recording of the behavior is enclosed. You’ll see as I attempt to click the tabs on the left-pane it doesn’t respond. I’ve rebooted multiple times since yesterday. I’ll keep investigating…
I am sorry to hear about this problem. Sometimes I have this issue as well, but as George was indicating, it usually is when I have a lot of things open in Wappler, which does not seem to be the case with you.
What you are looking for is this:
Choose the Restart with Logging option and then after Wappler starts up, you'll be able to find the log file in:
for Mac it is under:
/Users/username/Library/Application Support/Wappler/chrome_debug.log
or shorter: ~/Library/Application Support/Wappler/chrome_debug.log
(You can choose in Finder / Go To Folder ~/Library/Application Support/Wappler first)
After you find the file, compress it by right clicking on the file and then you can drag and drop the file here in this topic.
Thank you for the reply. I wasn’t looking in the far-right corner. Good eye! The debug log is enclosed. It’s getting frustrated as I cannot work but for only a first few seconds. I tried lowering the CPU from 8 to 1 in the Docker Preferences per a support forum on Docker; no difference.
I’ve deleted all my projects, reset my Wappler to default settings, and reinstalled Wappler. Same result. It just freezes and doesn’t respond. I’m happy to setup a screen-sharing session at your convenience or pay for support.
I’ve had the same problem with my Mac since Big Sur.
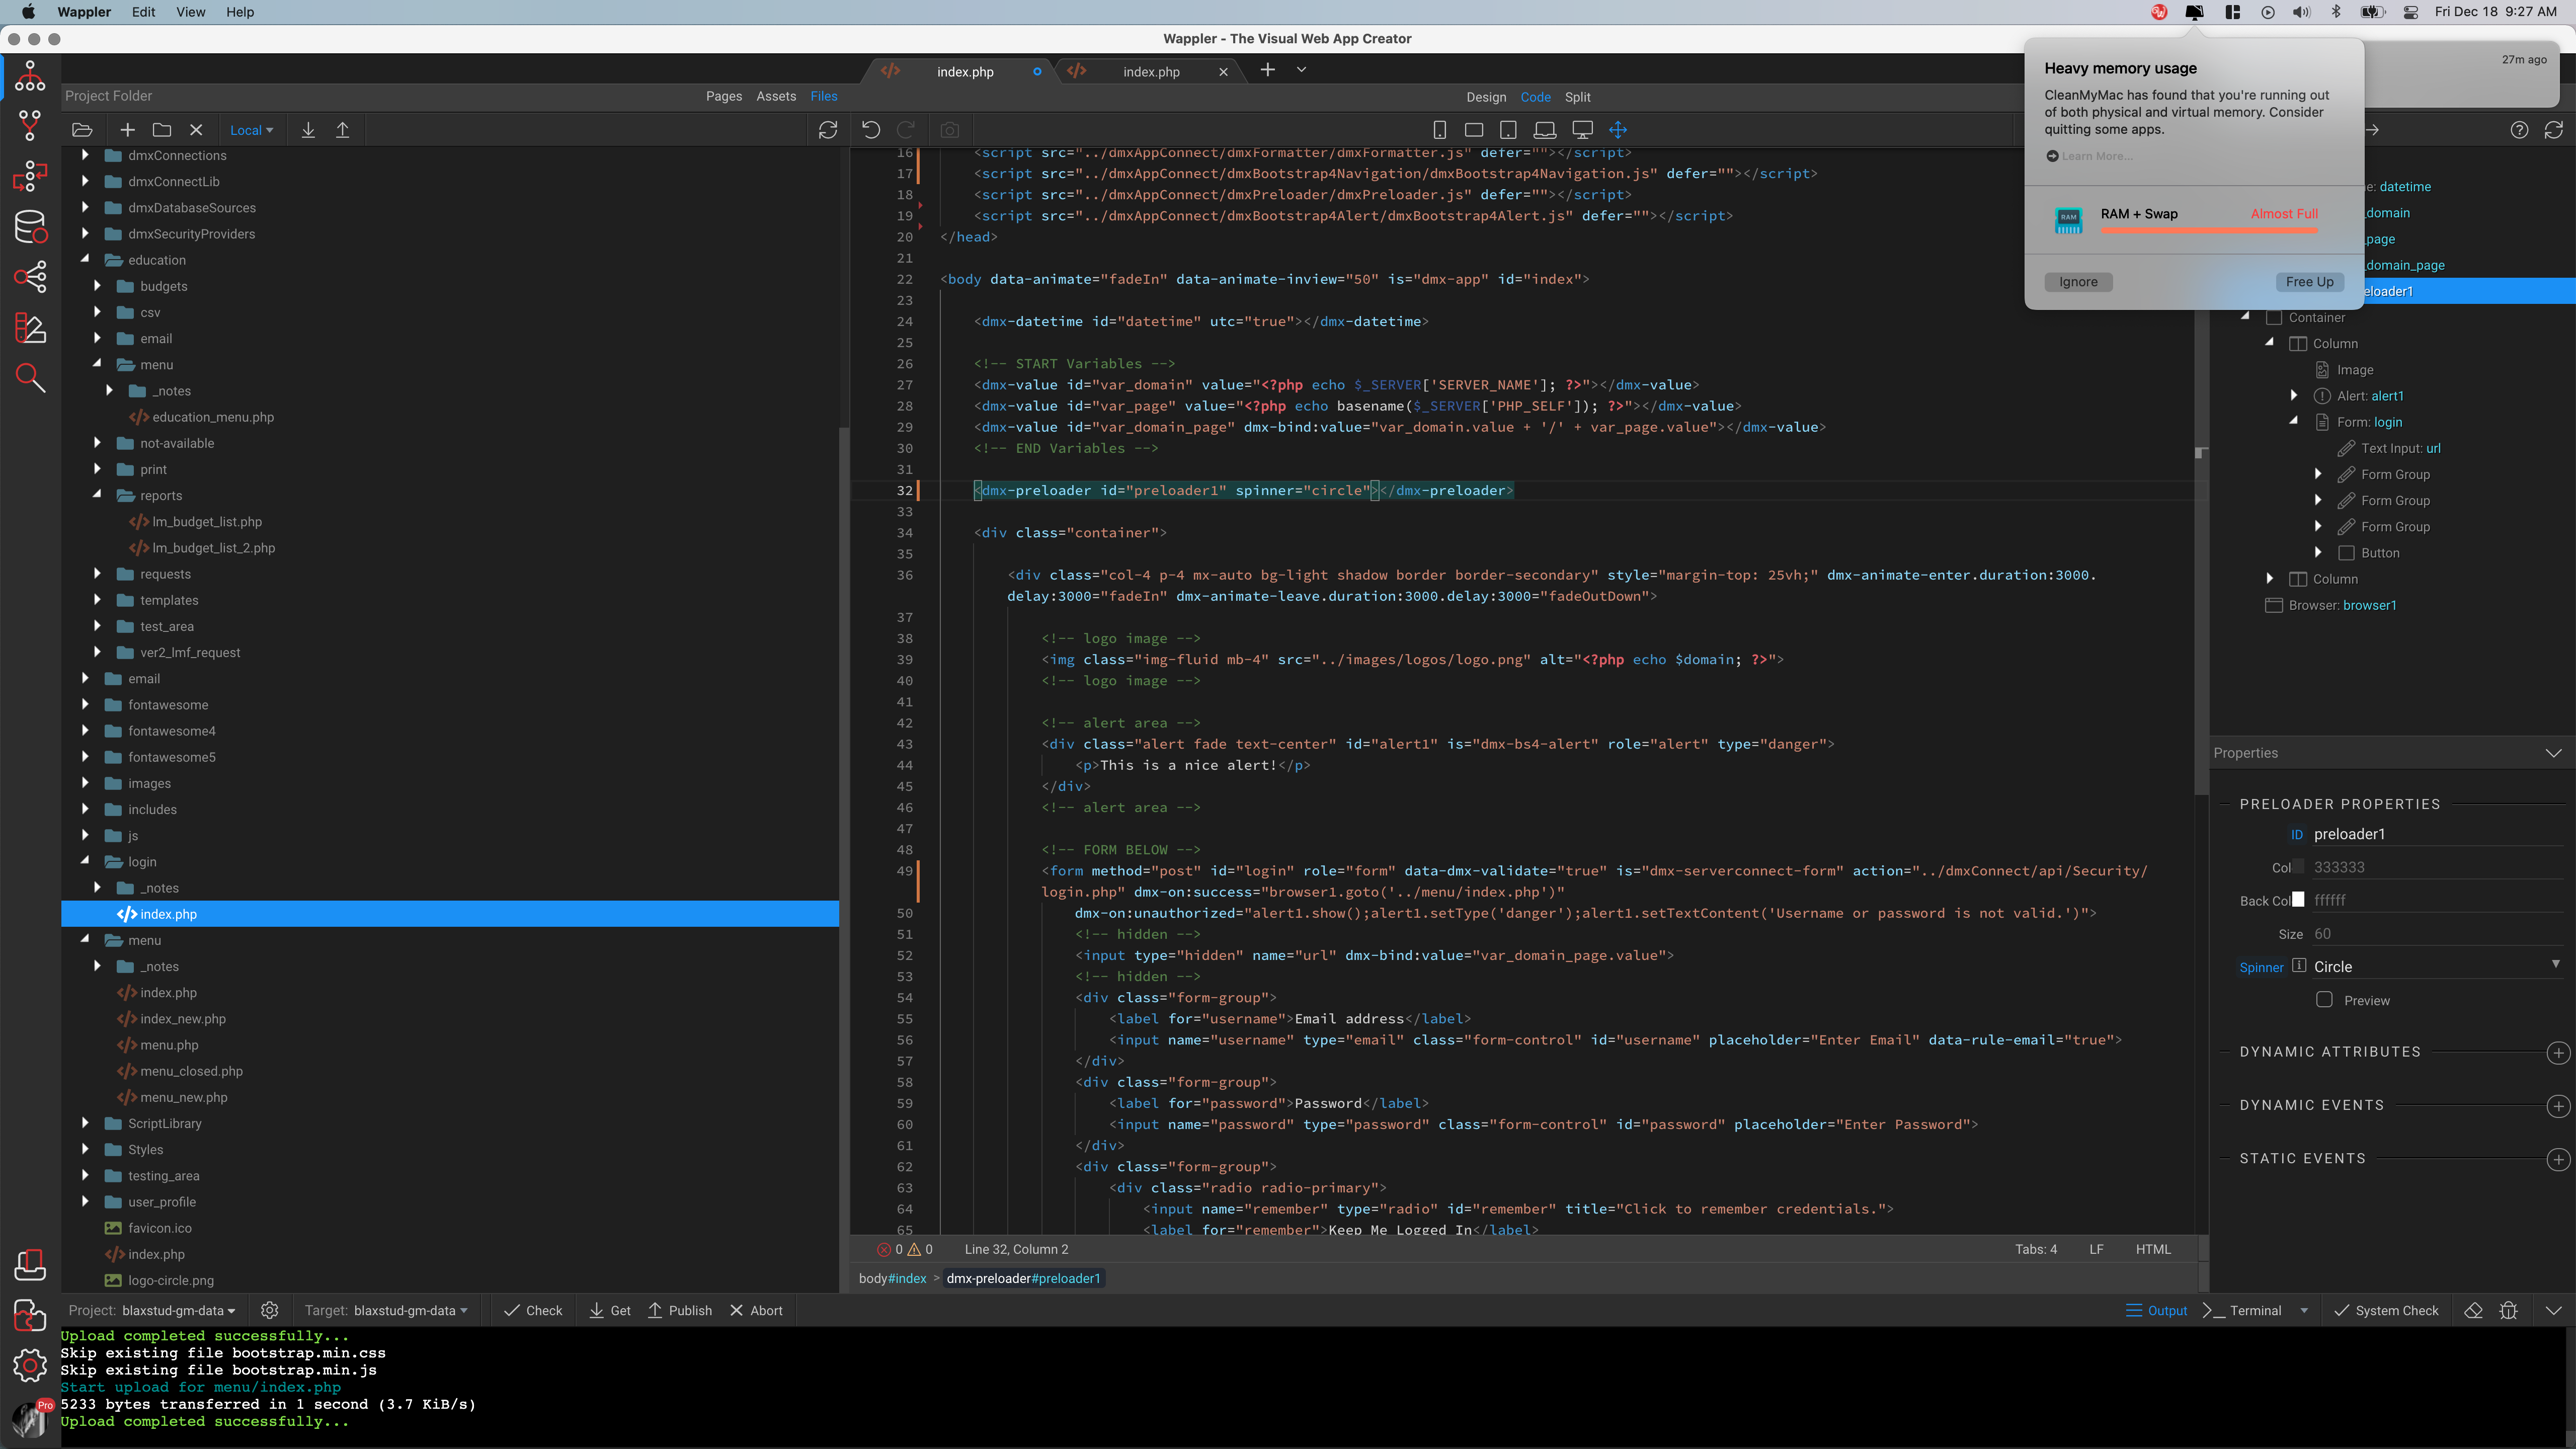
In my case, the machine’s memory (RAM) would drop after 30 minutes of working with a large page of coding and a lot of editing going on. I believe that it also would run short of drive space, which resulted in not having any room for dumping the RAM; additionally, it was trying to send a lot up to the cloud to make room… pretty soon resources would run low.
First I would get a memory alert from CleanMyMac, then window areas of Wappler would start shutting down various panes and turn them red (see images).
I found that if I shutdown nonessential items that were running in the background (those that are loaded on startup, and apps opened but not needed), after this restart Wappler, everything worked as it should without any further problems.
Techagentmo check and see if you have anything running in the background that can be eliminated.
I’m continuing to have issues with Wappler becoming non-responsive as I continue to learn and buildout the apps within the platform. I noticed that if you work locally 100% with no active database connections to a remote location or use Docker; it’s fine. At times; I get frustrated as I have to wait 20 - 30 seconds after each mouse click to progress. No other program is having an issue; dBeaver, mySQL Workbench, Chrome, Outlook, and Excel. I’ve attempted to only have Wappler opened and no other app; same thing.
I may need to do the same. Although I have no fan running, I am getting a warning of low ram.
My MacBook Pro only has 16 GB, but that has been sufficient with all previous versions of Wappler. These freezes and notices were not until we crossed over to 3.5+ …
The Wappler app is not a hog on ram, however could the nwjs renderer and helper be a bit weighty? Please note that I am no computer memory architect expert. It’s just an observation.