Editable Grid with DevExtreme Data Grid Tutorial

I’ve been looking for an editable grid solution for a while and recently came across DevExtreme. They have a whole bunch of what so far look to me like really good javascript components ( https://js.devexpress.com/Overview/Widgets/ ) including a data grid. The documentation and demos are really good so it only took me an hour or so to wrap my head around it and get an editable table up and running. The DataGrid component demos are at https://js.devexpress.com/Demos/WidgetsGallery/Demo/DataGrid/Overview/jQuery/Light/ and the API docs are at https://js.devexpress.com/Documentation/ApiReference/UI_Components/dxDataGrid/

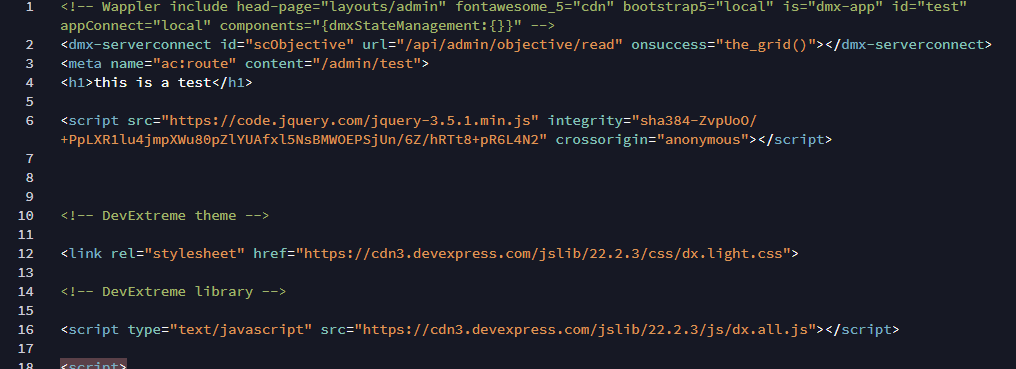
First of all you’ll need jQuery and the DevExtreme scripts loaded in your page head…

    <script src="https://code.jquery.com/jquery-3.5.1.min.js" integrity="sha384-ZvpUoO/+PpLXR1lu4jmpXWu80pZlYUAfxl5NsBMWOEPSjUn/6Z/hRTt8+pR6L4N2" crossorigin="anonymous"></script>


    <!-- DevExtreme theme -->

    <link rel="stylesheet" href="https://cdn3.devexpress.com/jslib/22.2.3/css/dx.light.css">

    <!-- DevExtreme library -->

    <script type="text/javascript" src="https://cdn3.devexpress.com/jslib/22.2.3/js/dx.all.js"></script>

Then you’ll need a container to hold the grid.
<div class="col" id="gridContainer"></div>

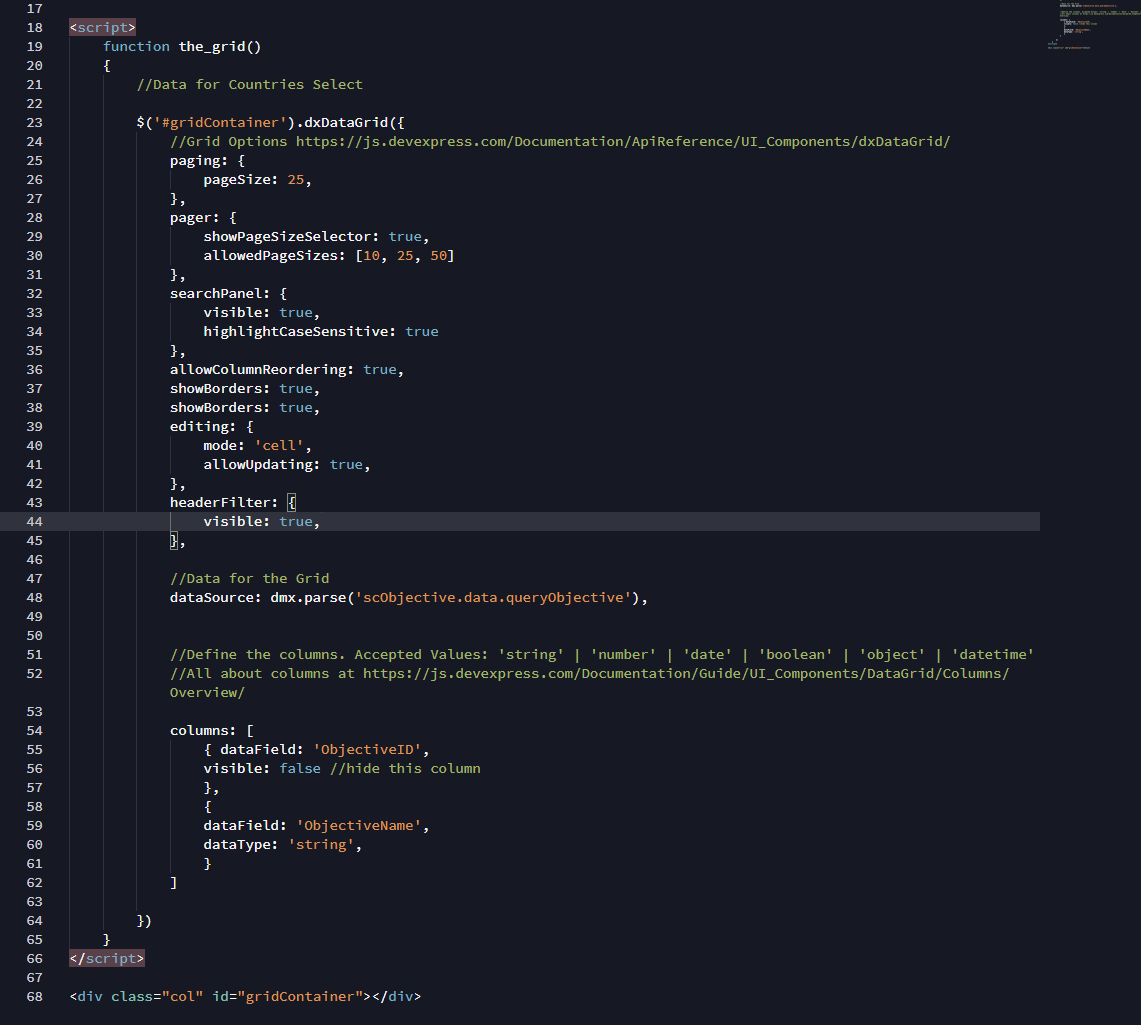
And below is the code. I tried to make it self explanatory but please feel free to ping me with any questions.

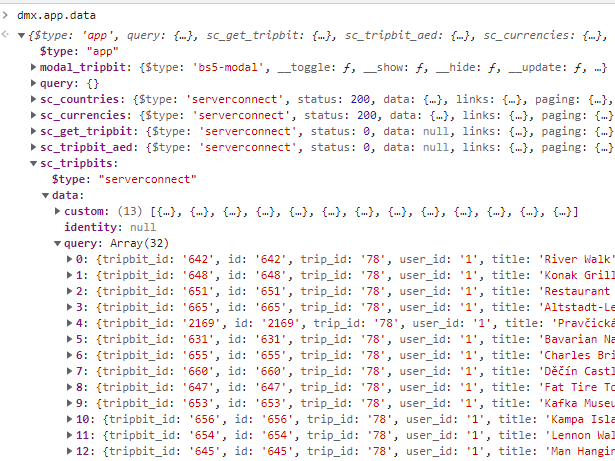
function the_grid(){
    //Data for Countries Select   
    const countries = dmx.parse('sc_countries.data.query');

    //Data for Currency Select
    const currencies = dmx.parse('sc_currencies.data.query');

    $('#gridContainer').dxDataGrid({
        //Grid Options https://js.devexpress.com/Documentation/ApiReference/UI_Components/dxDataGrid/
        paging: {
            pageSize: 25,
        },
        pager: {
            showPageSizeSelector: true,
            allowedPageSizes: [25, 50, 100]
        },
        searchPanel: {
            visible: true,
            highlightCaseSensitive: true
        },
        allowColumnReordering: true,
        showBorders: true,
        showBorders: true,
        editing: {
            mode: 'cell',
            allowUpdating: true,
        },
        headerFilter: {
            visible: true,
        },

        //Data for the Grid
        dataSource: dmx.parse('sc_tripbits.data.query'),


        //Define the columns. Accepted Values: 'string' | 'number' | 'date' | 'boolean' | 'object' | 'datetime'
        //All about columns at https://js.devexpress.com/Documentation/Guide/UI_Components/DataGrid/Columns/Overview/ 

        columns: [
                {  dataField: 'tripbit_id', 
                    visible: false //hide this column
                },
                {
                    dataField: 'start', 
                    dataType: 'datetime', 
                },
                {
                    dataField: 'end',
                    dataType: 'datetime',
                },
                {   dataField: 'title',
                    dataType: 'text'
                },
                {
                    dataField: 'country',
                    dataType: 'text',
                    lookup: { //create dropdown from countries dataSource
                        dataSource: countries,
                        displayExpr: 'name',
                        valueExpr: 'iso',
                    }
                },
                {
                    dataField: 'currency_id',
                    dataType: 'number',
                    lookup: { //create dropdown from countries dataSource
                        dataSource: currencies,
                        displayExpr: 'currency_code',
                        valueExpr: 'currency_id',
                    },
                },
                {
                    dataField: 'cost', 
                    dataType: 'number', 
                    format: {type: 'currency', precision: 2}
                }
            ],
            summary: { //https://js.devexpress.com/Documentation/ApiReference/UI_Components/dxDataGrid/Configuration/summary/
                totalItems: [{
                    column: 'cost',
                    summaryType: 'sum',
                    valueFormat: {type: 'currency', precision: 2}
                }]
            },
            //https://js.devexpress.com/Documentation/ApiReference/UI_Components/dxDataGrid/Events/
            //Change Row Color By Category Color.  My data sources has hex colors in the bgcolor field
            onRowPrepared: function(e) {
                if (e.rowType === "data") {                  
                    e.rowElement.css("color", e.data.bgcolor);
                    // or
                    //e.rowElement.addClass("my-class");
                }
            },
            //You can also change by cell
            onCellPrepared: function(e) {
            if(e.rowType === "data" && e.column.dataField === "cost") {
                e.cellElement.css("color", e.data.cost >= 100 ? "green" : "black");
                //could also add a class
                // e.cellElement.addClass("my-class");
            }
            },
            //open up my full editing modal on double click   
            onRowDblClick: function(e){
                //load the server connect to get the record clicked on.
                dmx.parse('sc_get_tripbit.load({tripbit_id: ' + e.data.tripbit_id + '})');
                $("#modal_tripbit").modal();
            },
            onSaved(data) {//update my data source when a field is updated
                var d = data.changes[0].data
                var id = d.tripbit_id;
                var start = d.start;
                var end = d.end;
                var country = d.country;
                var currency_id = d.currency_id;
                var cost = d.cost;
                var params = "tripbit_id: " + id + ", start: '" + start + "', end: '" + end + "', country: '" + country + "', currency_id: " + currency_id + ", cost: " + cost;
                dmx.parse('sc_tripbit_aed.load({' + params + '})'); //server connect to update your data source
            },
        })
}

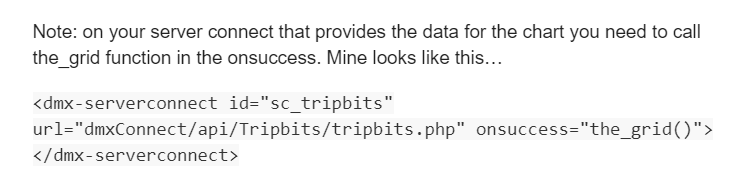
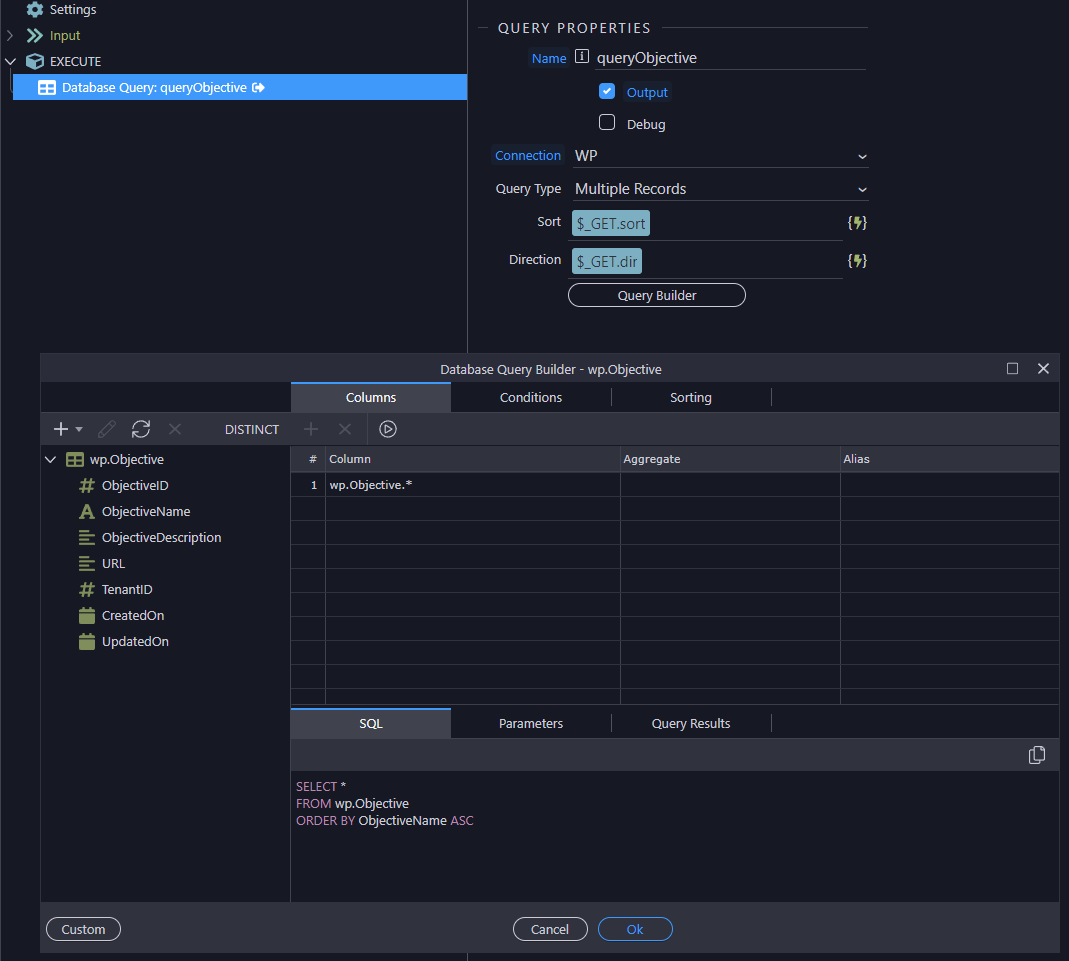
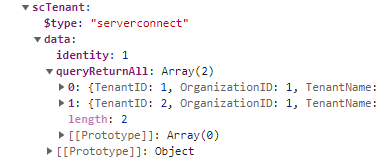
Note: on your server connect that provides the data for the chart you need to call the_grid function in the onsuccess. Mine looks like this…

<dmx-serverconnect id="sc_tripbits" url="dmxConnect/api/Tripbits/tripbits.php" onsuccess="the_grid()"></dmx-serverconnect>

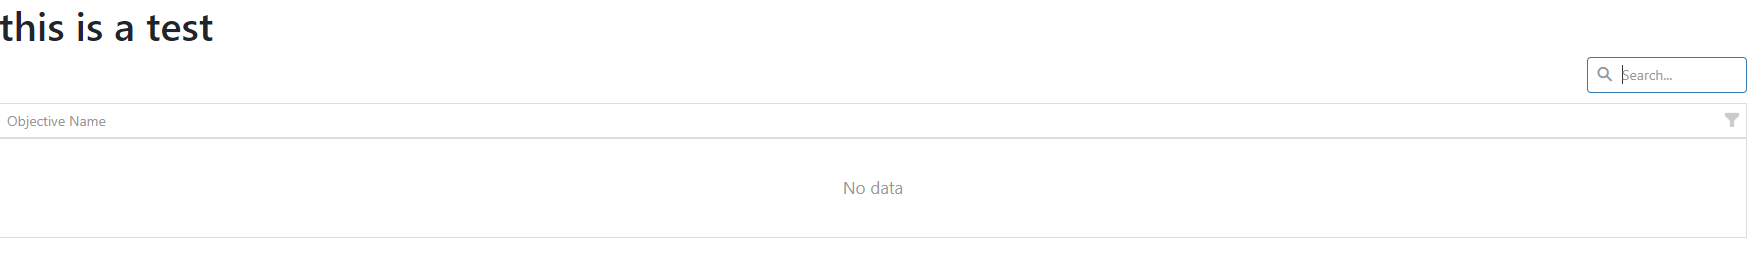
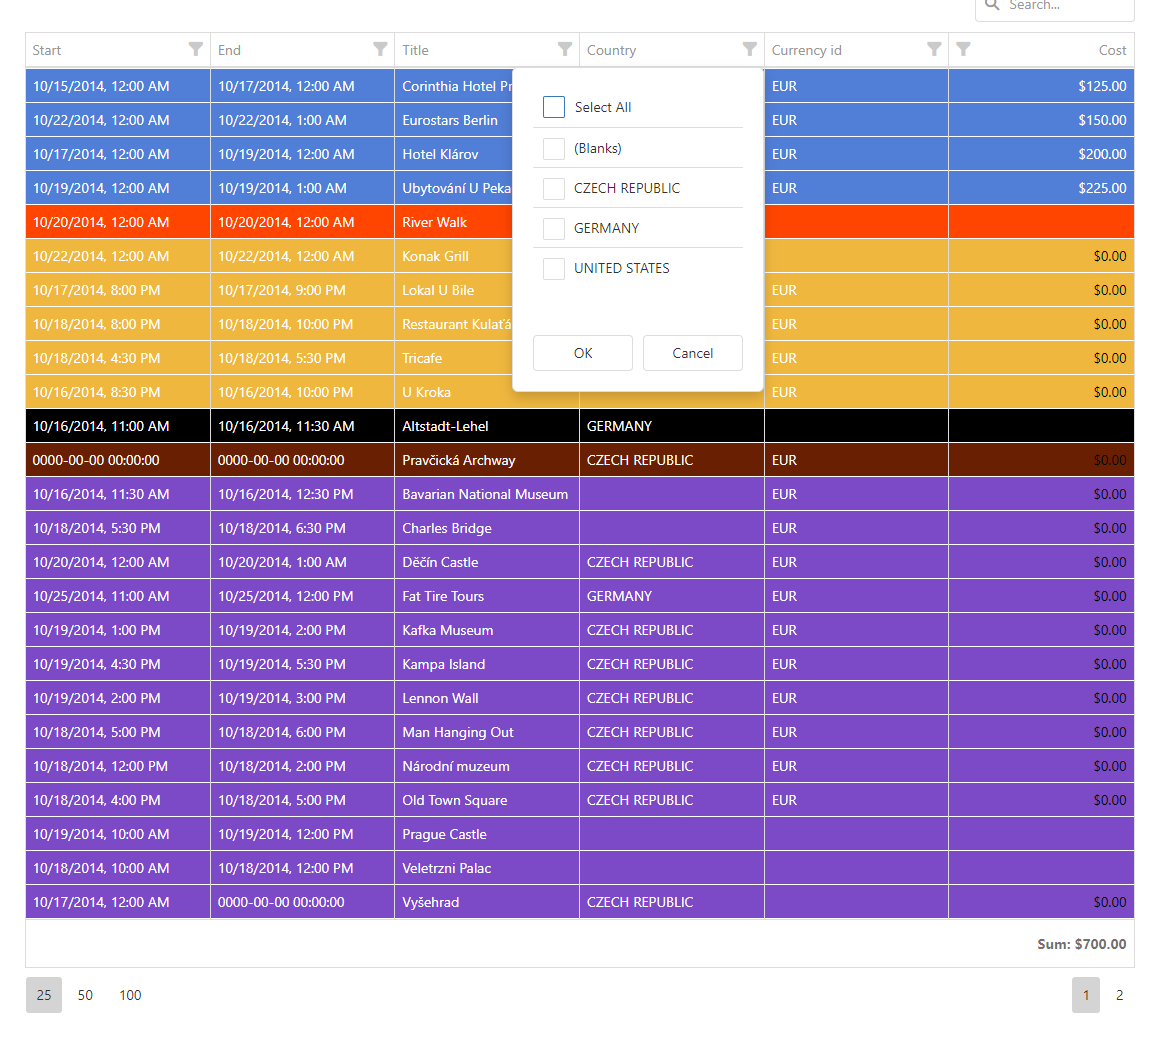
You’ll end up with an editable grid that has filter, sort, pagination, total, etc…
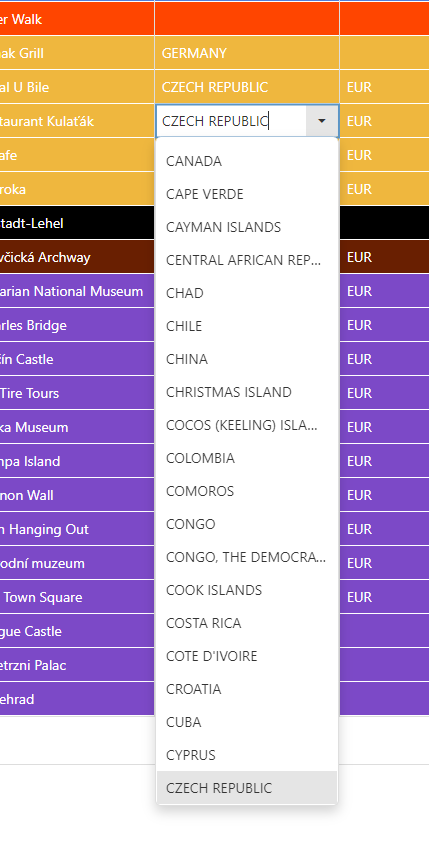
With lookup fields…

And built in date picker…
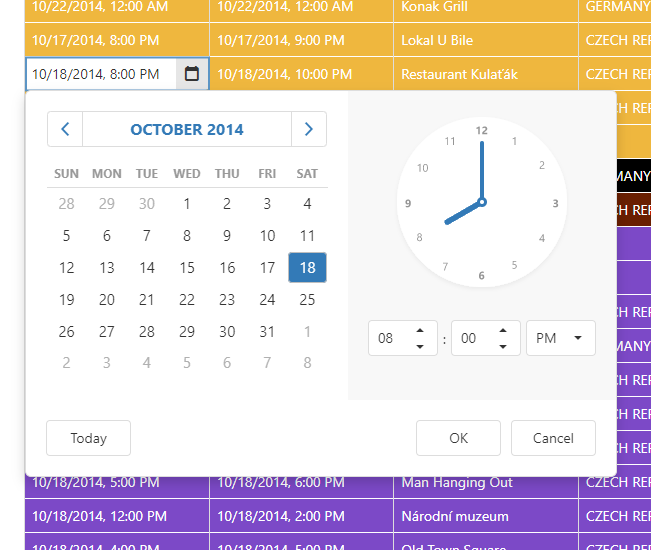
Voila!

7 Likes

Great little tutorial. We use DevExpress with Wappler often. Wished Wappler had a native grid like this.

1 Like

Thanks. There is an undocumented Custom Component feature - Custom App Connect components . I might give that a go, although @George said 18 months ago it might change and they still haven’t released it officially so not sure of the status. It would be super awesome to be able to integrate things like this easily!

I can’t get it to work. this is what I see


it just says No Data, even though this SC works great with another table. It seems like dmx.parse(‘scObjective.data.queryObjective’) code generates nothing. Does it need to be setup in a certain way to work?

this is the source code, i simplified it to the barest


Have you called your function in the onSuccess of your server connect?

I did, this is what mine looks like

Are there any parameters you need to pass to that server connect for it to return data?

no, i am just trying to get your example to work, so it’s a simple ‘Select *’ type query. when I use the same SC with a table generator, it works fine, so I know that SC can query and return data. And btw, thank you very much for helping me and getting back to me

No problem. Can you post the code for the table that server connect is working with.

here you go, is this what you are asking about?

In developer tools in your console can you see what scObjective is outputting?

In case you don’t know how to do this, type dmx.app.data then enter. That will show you all the data wappler is outputting. Mine looks like this…

image

had to look for it under Content

Try dmx.parse(‘content.scObjective.data.queryObjective’)

Found this regarding dmx.parse in a content page - Does dmx.parse work when the serverconnect located inside Content Page?

TIL.

Yup that worked! Now I am trying to get the lookups for the dropdowns inside to work. Thanks much for your help, hopefully I will be able to get that working as well

Excellent! Feel free to ask if you need anymore help.

1 Like

it seems that there is another problem. I would like to have a drop down inside the table that renders my tenants. the tenant is populated and I am able to query the size of it in the beginning of my the_grid() function, so it can see its contents. however, the lookup does not seem to work and the dropdown ‘generates no data to display’. Initially the_grid function did not see the scTenant so I am passing it in as a parameter…

image
image

Is your function calling the data source tenants or v_tenant?

I have tried all options:
{
dataField: ‘TenantID’,
dataType: ‘number’,
lookup: { //create dropdown from countries dataSource
dataSource: tenants,
displayExpr: ‘TenantName’,
valueExpr: ‘TenantID’,
}
}
and

dataField: ‘TenantID’,

        dataType: 'number',

        lookup: { //create dropdown from countries dataSource

            dataSource: v_tenant,

            displayExpr: 'TenantName',

            valueExpr: 'TenantID',

            }

        }

I have a suspicion that in a content page, variables declared outside of $(’#gridContainer’).dxDataGrid() are not being seen

so the problem is the following, if my SC has more than one query in it, nothing works, regardless of how the parsing is being passed. After I changed the SC to join two queries into one (I have to do it to limit data by user identity) everything started to work regardless of how I pass the data to the table. this control is very sensitive to that. Outside of this control, I am able to see the data from any other javascript-based way.