Custom Query JSON Error on Execute for Schema

Wappler Version : 4.7.0
Operating System : Windows 11
Server Model: NodeJS
Database Type: MySql
Hosting Type: Docker

Expected behavior

Press the ‘Execute Query’ button and get the output plus automated schema.

Actual behavior

The following error persistently happens.

How to reproduce

Create a new custom query, then press ‘Execute Query’.


Please find attached the Wappler logs.
wappler.zip (2.7 KB)

Are you probably trying to run this custom query on a remote target, as it won’t work:

Hey Teodor,

No, it’s not remote. It’s a local docker environment.

Cheers

Can you please double check what exactly is selected in Wappler as the error is the same as here:

As you can see from the screenshot below, I have no remote targets set up. Only my local development target.

Hi.
Have you tried to run the query in an external tool like Navicat or DBeaver?
It could be that the query itself has some error?

Hey Sid,

Yep, I’ve run the query with parameters with DataGrip and works perfectly.

Just FYI, I’ve rebuilt the query with the standard Database Query module now (it was an old custom query). But I have plenty of other custom queries I worry about now.

Custom query execution throwing an error in the UI does not necessarily mean that the query will fail when running on page.
You can try to just save the query as is, and execute SA in browser - directly or from a Server Connect.

I usually tend to rely more on DBeaver for testing my custom queries than the Wappler UI. I sometimes miss out on schema due to that… . :sweat_smile:

1 Like

Unless other people are running this same setup in their node projects and have no related query problems in Docker then this make no difference, however, I see your project Node.js Type is “Slim”

And your version is 16.?.? while current version is in the 17 range as is the Slim package.

Perhaps either making sure you have the latest Slim update loaded or choose to run the standard js node with all the bells and whistles.

  • node:-slim

This image does not contain the common packages contained in the default tag and only contains the minimal packages needed to run node. Unless you are working in an environment where only the node image will be deployed and you have space constraints, we highly recommend using the default image of this repository.

Not sure what you’re getting at here. The custom queries have been working quite seamlessly until I updated to 4.7.0. Hence the bug report.

That is why I posed the question the way I did.
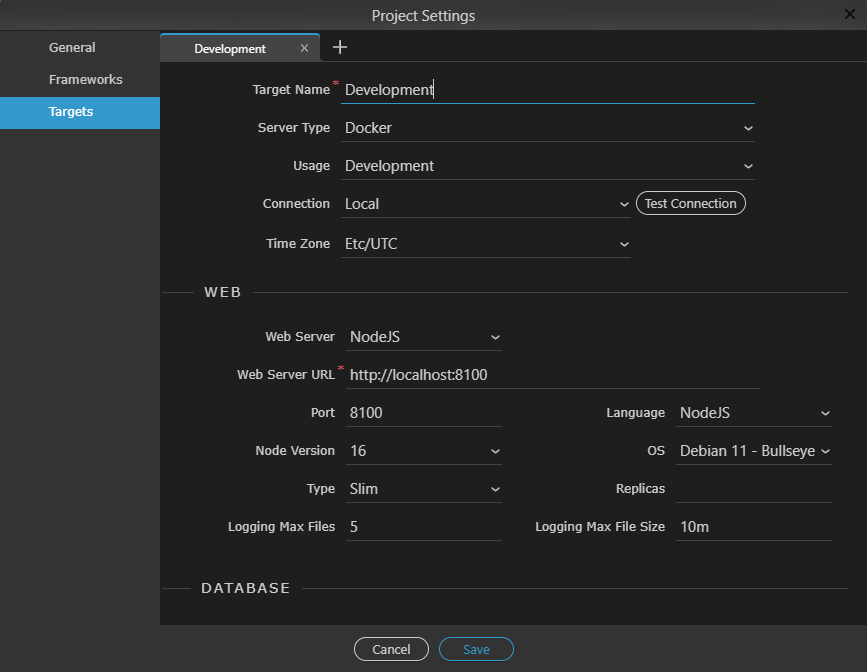
If you know that the version of your Docker package and the Node version of Slim is completely the same as before you relaunched with 4.7.0 then look elsewhere.

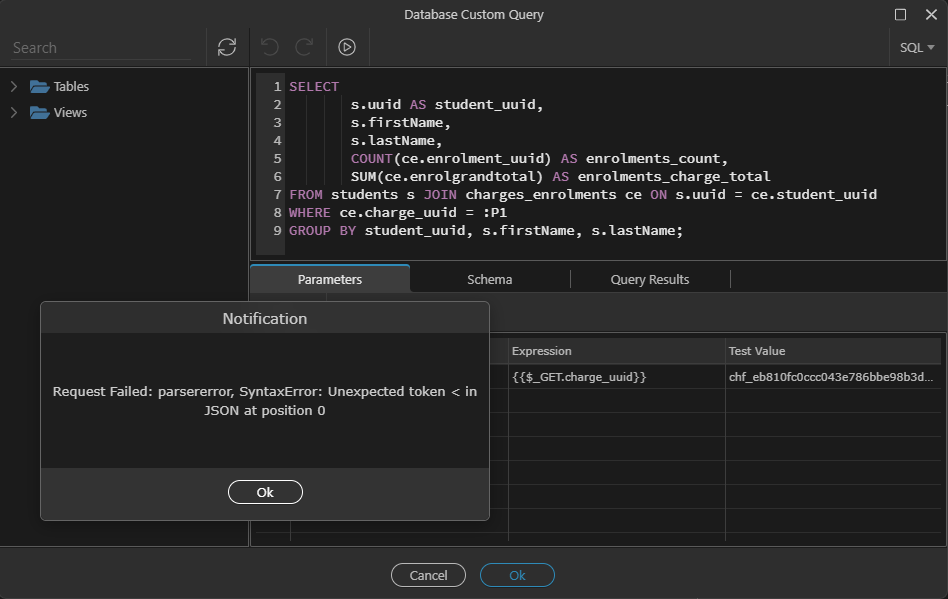
But the other day I researched your problem with the failing json return to your query.

I found recent references to “the same error message” showing up in the last couple of weeks that seemed to track back to Slim and Docker packages.

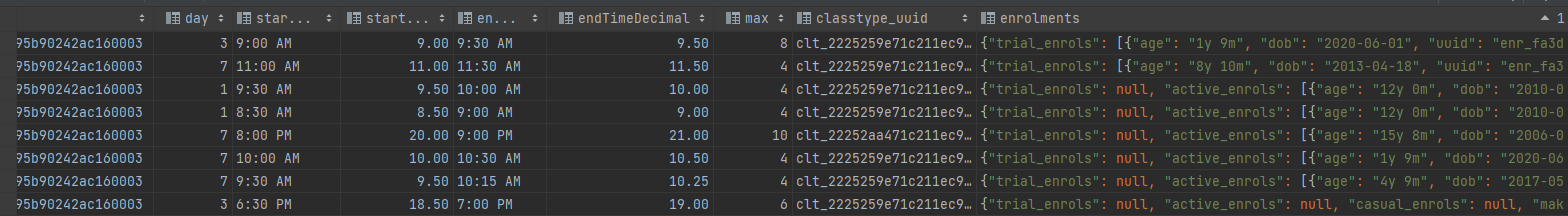
But I find frequently that your response is associated with it being returned as html as in a html body instead of as a valid json file format.

205 votes

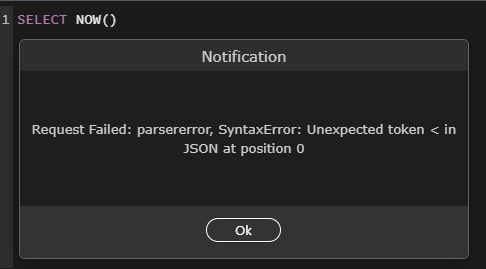
The wording of the error message corresponds to what you get from Google Chrome when you run JSON.parse('<...') . I know you said the server is setting Content-Type:application/json , but I am led to believe the response body is actually HTML.
Feed.js:94 undefined "parsererror" "SyntaxError: Unexpected token < in JSON at position 0"

with the line console.error(this.props.url, status, err.toString()) underlined.

The err was actually thrown within jQuery , and passed to you as a variable err . The reason that line is underlined is simply because that is where you are logging it.

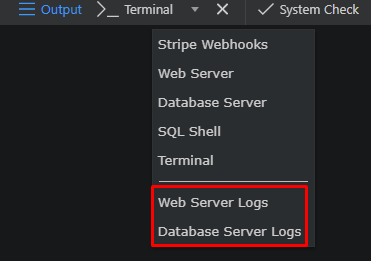
I would suggest that you add to your logging. Looking at the actual xhr (XMLHttpRequest) properties to learn more about the response. Try adding console.warn(xhr.responseText) and you will most likely see the HTML that is being received.

You can also got to Developer Settings -> Network Tab to see the response which you are actually getting.
This happens when you are running backend and frontend on the same server (e.g., localhost). To fix that, in the package.json inside your root project folder, add this line: "proxy": "http://localhost:5000" , (or your port instead of 5000 you want your request back).

Shivam Jha

Sep 23, 2020 at 7:19

Other experiences with a solution that you may already know do not apply:

You are getting an html file instead of json.

Html files begin with <!DOCTYPE html> .

I “achieved” this error by forgetting the https:// in my fetch method:

fetch(`/api.github.com/users/${login}`)
    .then(response => response.json())
    .then(setData);

I verified my hunch:

I logged the response as text instead of JSON.

fetch(`/api.github.com/users/${login}`)
    .then(response => response.text())
    .then(text => console.log(text))
    .then(setData);

> Yep, an html file.
> 
> ## Solution:
> 
> I fixed the error by adding back the  `https://`  in my  `fetch`  method.
> 
> ```
> fetch(`https://api.github.com/users/${login}`)
>     .then(response => response.json())
>     .then(setData)
>     .catch(error => (console.log(error)));
> ```
  1. The packages are exactly the same as before upgrading to 4.7.0.
  2. The queries run perfectly fine on:
    a. DataGrip
    b. SQL Workbench
    c. VSCode

I might add that none of this is happening in the browser or a custom module. It’s happening on ALL custom queries in the Custon Query Editor. See below:

Thus, I can only conclude that there is something wrong in Wappler.

The query in your example is returning hierarchical json data. Are you getting the same error as on top?

Custom queries expect to have a tabular return data not hierarchical.

For such nested json structures you might want to try the new sub tables and nested queries.

Hi George,

Yes, I get the same error. With the query you’re referring to, it has been working for the last 3-4 months and outputs the below.


AND

Well it seems there is a problem in executing the query in your database.

Where is your database located?

If you enable the debug in Server Connect Global options, you should be able to see more info.

Check the web server and database logs in Wappler:

image

Hey George,

So sorry for the late reply, been a very busy week for me. I’m not sure why it would be a problem executing in my database when the actual app still runs the custom queries without issue, and DataGrip executes the queries without problem either.

The only thing I can see from my logs are that it cannot find a login cookie when running the query, thus the restrict kicks in. webserver-log.zip (4.1 KB)

Below are the same two queries run in Wappler and DataGrip.
image

image

1 Like

The same problem occurs to me. Using customized queries results in the same error. Even basic queries do not work. Help me

Are you sure your issue is not the same as here:

If not - please provide some more details about the project, database, hosting type etc.

Custom queries that were previously successful do not work now. This is a different problem from the link you showed me.

So please post a new topic with more detailed explanation. “Custom queries do not work” is not really a helpful report of the issue.