I am currently on the latest version of Wappler 7 on a Macbook pro (2.3GHz i9 and 32GB of RAM). It's a decent machine with plenty of grunt.
When I open Wappler for the first time upon booting up it works great. Then it gradually slows down and performance becomes very poor. After a few hours of use eventually it just freezes and I need to exit Wappler and restart it.
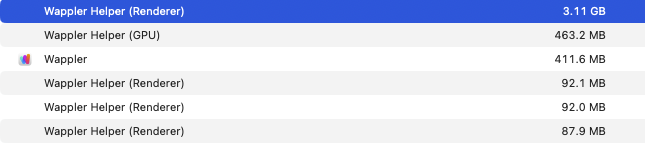
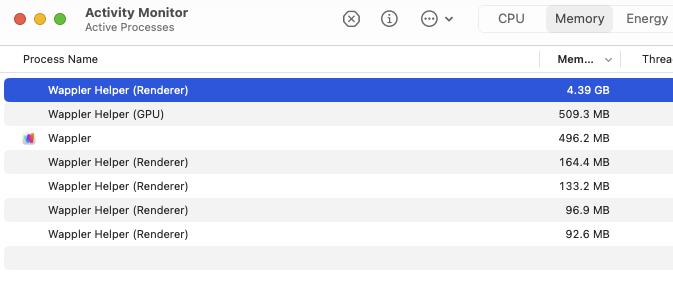
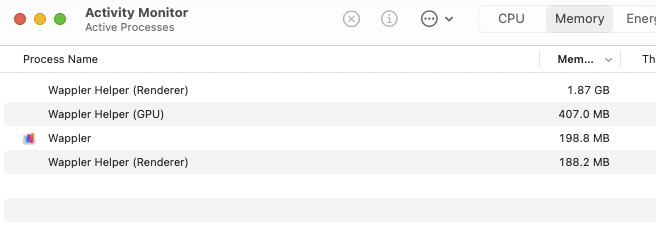
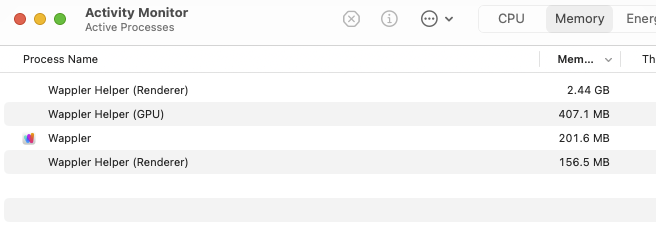
Yes, I have the same issue on MacOS and I'm noticing performance issue more with the latest version 7. I have MacBook M2 Pro with 16GB RAM. After using Wappler for about an hour or so, the memory usage gets up to ~2GB from the starting memory of ~500MB, and the app becomes slow to respond. I have to restart Wappler to free up the memory and get the performance back to normal levels.
I'm on a Mac Studio M1 and a MacBook Pro M2 Max and both are left running for weeks on end without any issues. I've kept up with the latest version throughout.
Yes, issues every day. I’ve been trying to make a proper bug report but haven’t had time or anything particularly useful.
One suspect for me is the dynamic bindings selector panel. I feel like the search for elements in that is overloaded. Or maybe that is just where I see it the most.
I see regular problems too. I've reported it before and find it is most obviously problematic when there are modals/conditional regions/ collapses on pages - my theory is that they aren't being destroyed each time the design window is refreshed (especially as it refreshes with pretty much every keystroke in code view)
in Wappler 7.1 we have greatly improved memory usage. So you shouldn't see big increase on longer usage. Even more memory optimizations are coming up in the next update
Hi @george,
glad to see more improvements are coming - sadly, I'm not sure that the last release made too much difference (but I really do appreciate that you're giving it some attention)
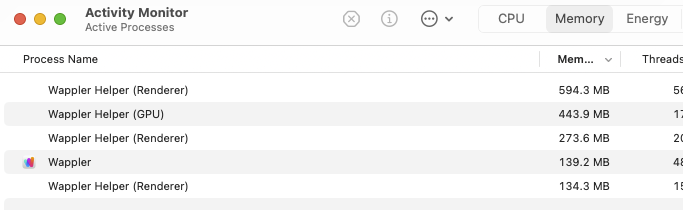
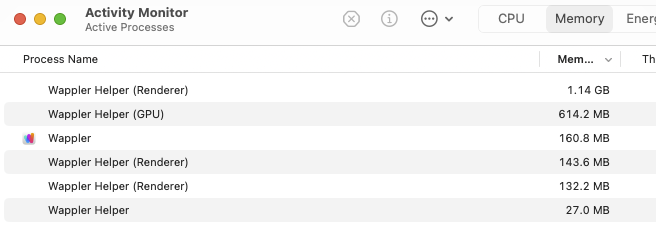
Could you try again with clean Wappler start for an hour and describe your actions, tab editors open, close, pickers, and what was the memory before and after.
It is worth noting that this page has a few conditional sections, a couple of modals and off canvases. I mainly work in split view and find it much quicker to use code view for most of my edits. When working I have App Connect disabled from the lightning bolt in the toolbar (it is my chosen system default)
If you need to know anything else, let me know
edit:
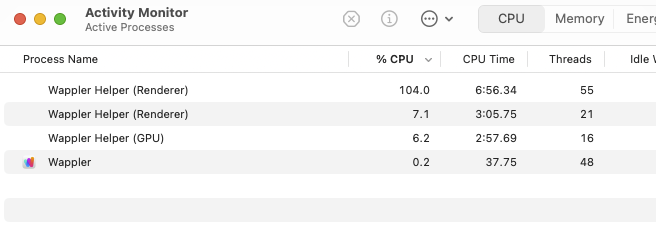
As an example, I simply added the disabled class to a button (typing in code view) and the CPU spiked and UI became unresponsive for about 5 or 6 seconds. I'm sure there's something going on when the design view refreshes - it is most evident, like I have said several times before, on pages that have a combination of multiple conditions/modals/off canvas/repeats etc.
edit2:
Ruling out spec, I am working on Mac Mini with M4 Pro and 24GB RAM
Has been doing this for a while. I've upgraded my laptop recently to an i9 with 32gb of memory so not noticing it as much as I used to. Definitely the constant refreshing I'm sure of it but then I'm no expert so am just agreeing with @bpj as in this seems the most likely culprit for the issue.
It's such a time-consumer that I'm now doing most of my coding in Visual Studio where I can work as fast as I want. It's a shame because I really want to be in Wappler doing everything