Not sure if it’s related but I get a LOT of memory usage and system slowdown on pages with modals (tends to be where there’s a few modals) - just wondering if they’re not being properly destroyed when redrawn in the design preview. As you edit, particularly in code view, frequent refreshes make it slow down.
The main project I see this on is an older BS4 PHP one - just in case that makes a difference (that is also the only one I have with such heavy modal usage)
I have highlighted this specific reason for the increase in memory usage in my other posts. The memory usage keeps creeping up every time code view is saved and design preview is refreshed.
I have to restart Wappler every 2-3 hours when work is primarily being done in the code view, otherwise the application becomes noticeably sluggish in response to every click.
I haven't tried RC yet but it has been a thing for years in both stable and beta (I have use beta all the way to b33). It has been mentioned several times in the past but many of those posts are now unlisted so hard to find.
Maybe you explain in more details what do you have on the page and what is happening / how to recreate this.
We can't see any memory increase working in code view in Wappler, so more details will be really helpful.
In my case, the increase in memory usage happens when pages are being saved frequently and design view refreshes to render the latest modifications in the html code.
This is only an issue when I'm working primarily with the html code for a couple of hours and saving the modifications frequently in quick succession.
I can confirm the same issue on my side, on a page with a couple of modals I've been editing frequently.
Wappler is currently sitting at 6 GBs of RAM usage after about an hour, which isn't super high for my system overall, but it does keep climbing excessively the more I edit until I restart Wappler when it drops back down to less than 1 GB. The editor also starts to slow down as already mentioned here.
Yes, I’m experiencing the same issue. Every time I spend a while working in code view, especially with larger files or projects, memory usage goes up significantly and Wappler starts to slow down. Eventually I need to restart it to get performance back to normal. It happened in all the beta versions and now it’s still present in RC1.
After an hour since the last restart on Wappler. Just from editing server connects and a couple of pages. I don't think this is strictly code view related
I find it happens most frequently on pages with modals (and I'm editing the content of the modal), but I have also experienced it with other components such as collapses.
In many cases, I am manually editing a form on a modal because I like to change them to Bootstrap input groups, which aren't supported by the UI. Each time I edit a div, class, span etc. the design view is reloaded and seemingly over time, builds up the memory consumption.
There is no specific reason. It happens to me on every single page for me. I have to keep VSCode open to make edits when Wappler becomes slow, since restarting Wappler is too time consuming.
Not sure how this is relevant while working in code view - not split or design view.
Additionally, if I work on Server Actions (tree view), there is never any performance issue. No matter how many SA tabs I have or how many steps are there.
But working on even a single tab in code view makes Wappler extremely slow in few minutes.
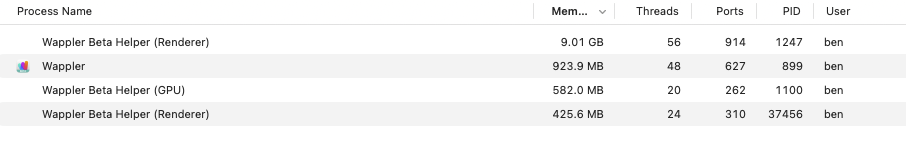
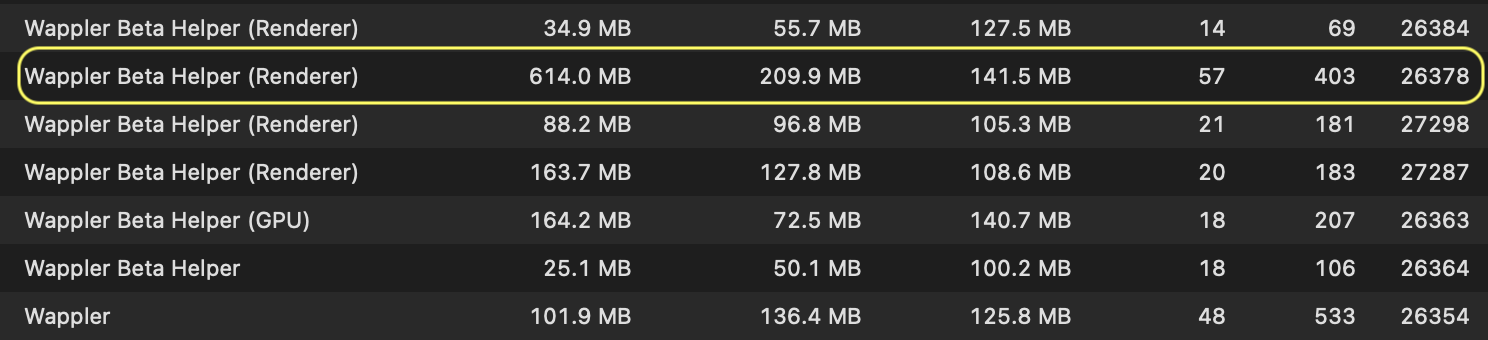
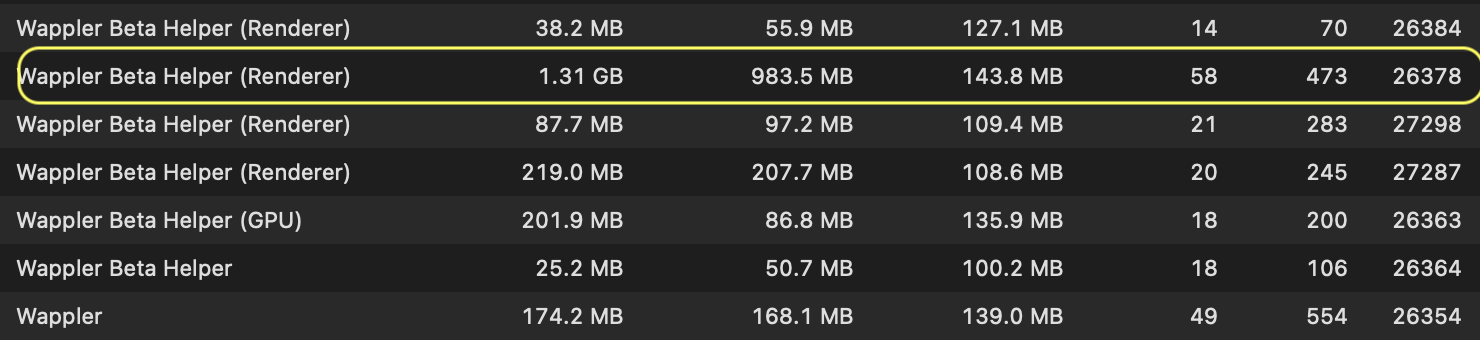
I took these screenshots after working for less than an hour in the code view, showing an increase of usage in memory ranging from doubling to 4 times (highlighted Process ID).
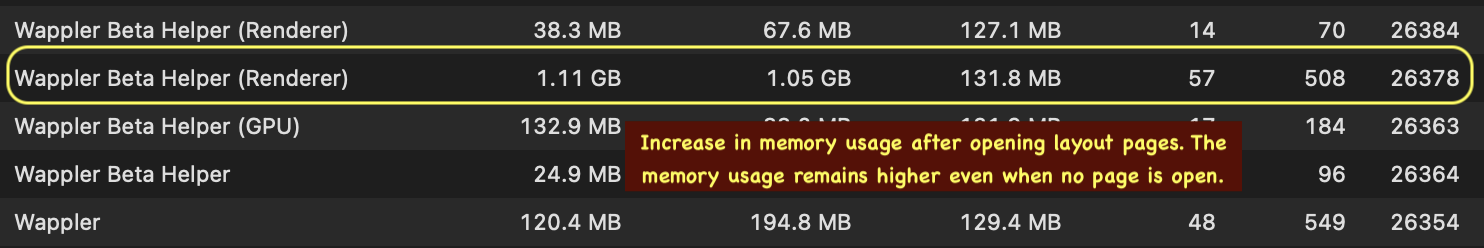
This is a screenshot after opening and closing layout pages (two in my project). There's a spike in the memory usage and the high usage doesn't settle back down even when no page is open. The only way to release this memory is by restarting Wappler.
I also noticed that each page (layout and content) that is open in the wappler IDE spawns a separate renderer process. So, if these pages do not need to stay open, then it's better to close them in Wappler to release memory resources.
HTML pages (layout and content) get rendered in a separate sandboxed webview (design view) which has its own renderer process to prevent Wappler from crashing if there are problems on the user's page. The webview is always loaded, even when you have only code view open. The side panels rely on communication with the webview to retrieve some live data from it.
Thank you for explaining the rendering process in a separate sandboxed webview and the reason behind it. Since I have seen these separate rendering processes in the activity monitor, I close all the pages that I'm not working on to preserve system memory.
But that's not the main reason for a spike in memory usage. It is happening from frequent saving of the code view. I also saw a huge spike in memory usage when layout pages are opened, and once this memory is in use, it is not released by the system automatically, and requires a restart of the app.