Intro
Leaflet Maps is a lightweight, open-source JavaScript library for creating interactive maps on the web. It offers simplicity and versatility, making it easy to integrate dynamic maps with custom markers into your Wappler projects.
Inserting Leaflet Maps
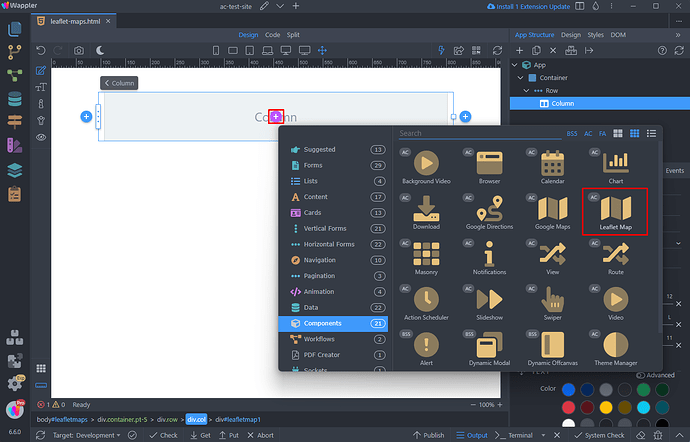
First we will start by adding a Leaflet map on our page. We have a simple layout - a container with a row and column. Click the add new component button inside the column and under Components select Leaflet Map:
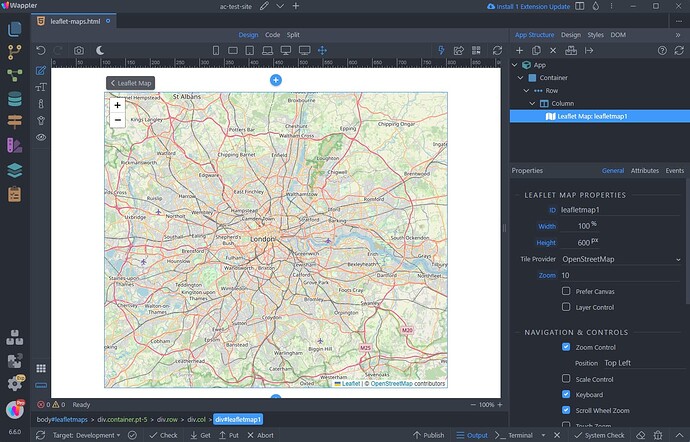
You can see the map has been added on the page:
Basic Options
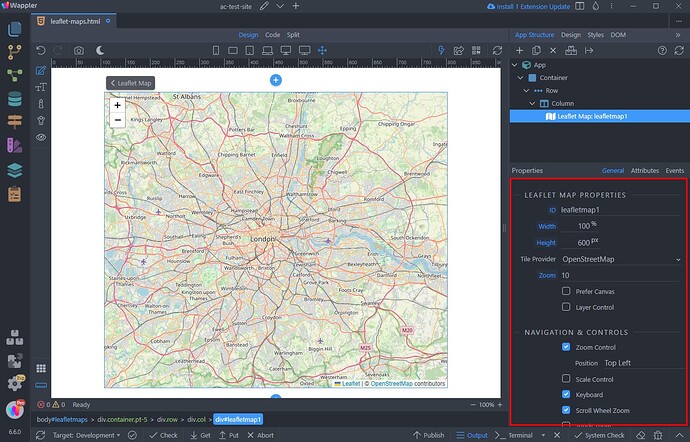
You can find the map properties in the properties panel. Here you can setup options like width, height and others:
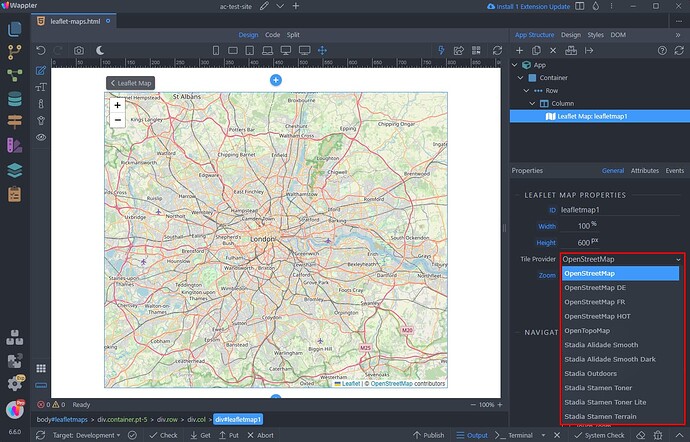
You can choose between different map tiles providers. The default one is OpenStreetMap:
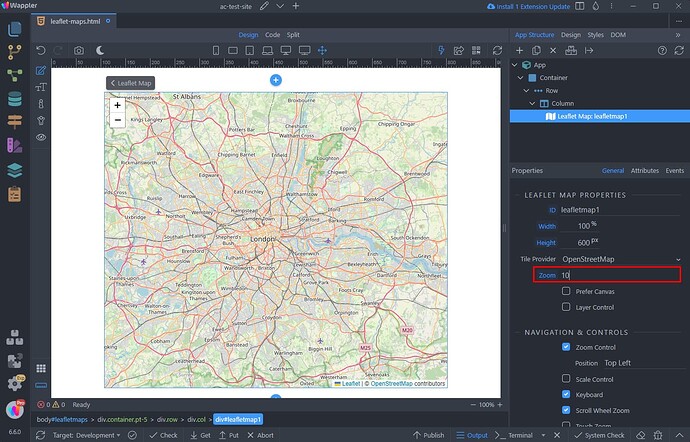
Set the initial zoom level (usually 0 to 19) for your map:
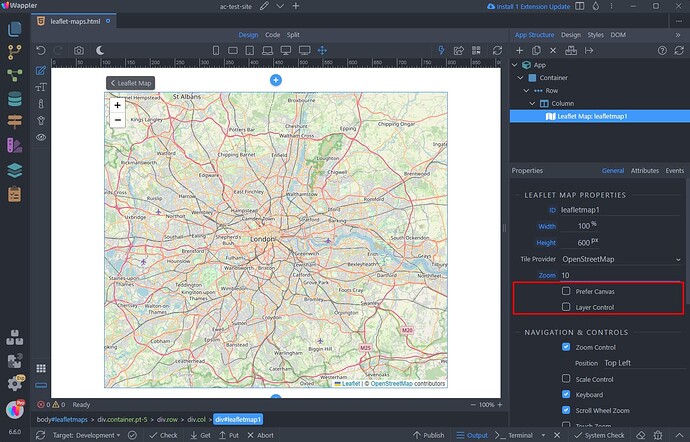
The Prefer Canvas option in Leaflet Maps forces the map to render using the HTML5 Canvas element instead of the default SVG. This can be useful in situations where performance is a concern, such as when displaying a large number of markers or other dynamic map elements.
Enable Layer Control to allow users to switch between different map layers and overlays:
Navigation & Controls
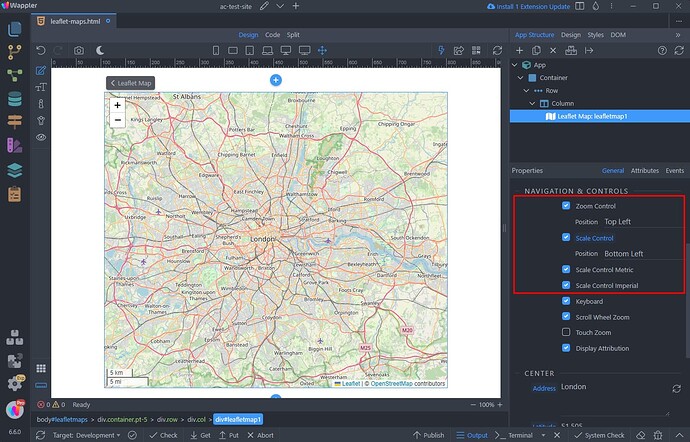
You can enable or disable the available control options, such as scale and zoom and select positions for them. For the scale control you can choose whether to show metric or imperial scale line or both:
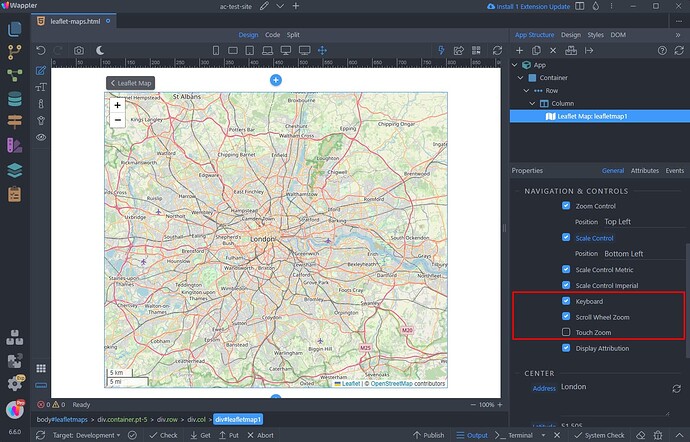
Enable the Keyboard option in order to make the map focusable and to allow users to navigate the map with keyboard arrows and +/- keys.
You can also enable or disable the mouse Scroll Wheel Zoom and Touch Zoom:
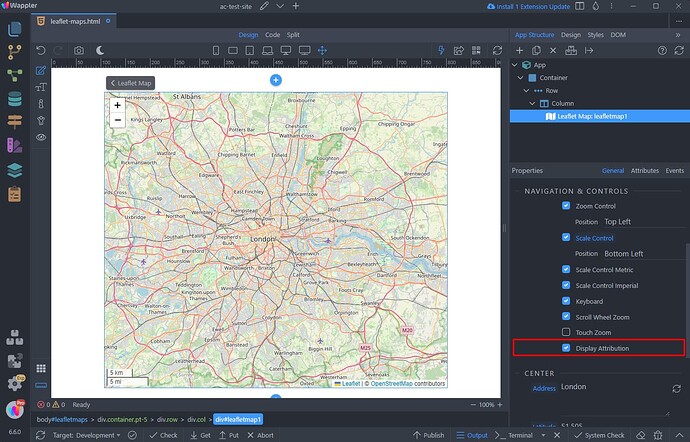
The attribution option allows you to display attribution data in a small text box on the map. You can turn this option off, if you don't want to show the attribution text:
Map Center
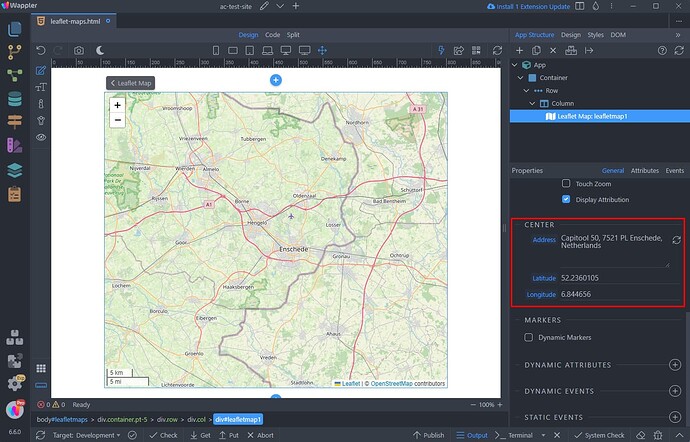
You can set the initial center of the map. This should the geo coordinates of the address (Latitude and Longitude). You can easily convert your address to Lat/Lon coordinates by pasting the address in the Address field and clicking the convert button next to it:
Markers
You can easily add static or dynamic markers on your Leaflet map.
Static Markers
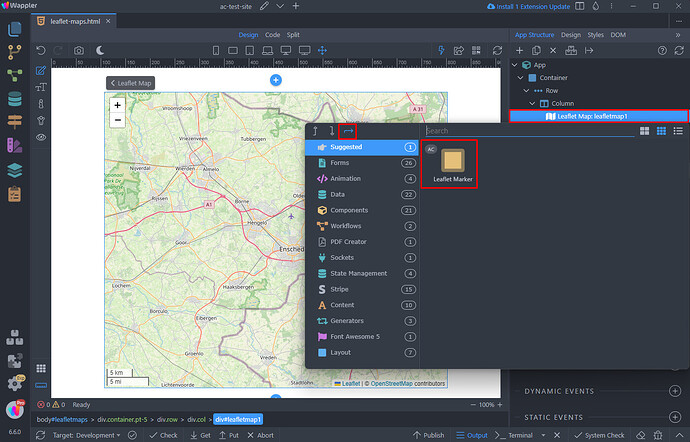
Let's start with the static ones. Right click the Leaflet Map component in the App Structure. Select Insert Child and select Leaflet Marker:
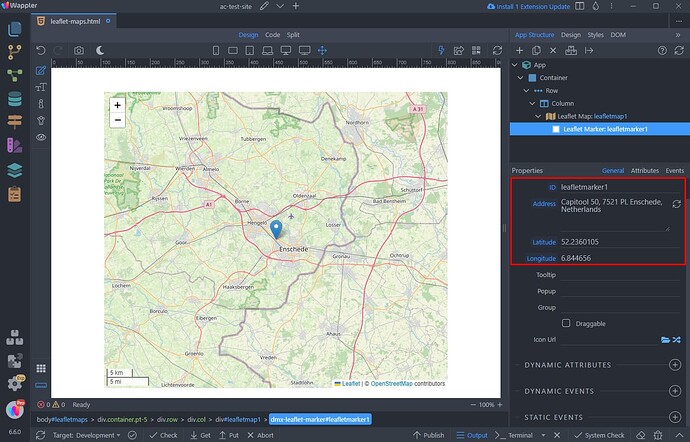
Enter the geo coordinates (Latitude and Longitude) for the marker. You can easily convert your address to Lat/Lon coordinates by pasting the address in the Address field and clicking the convert button next to it:
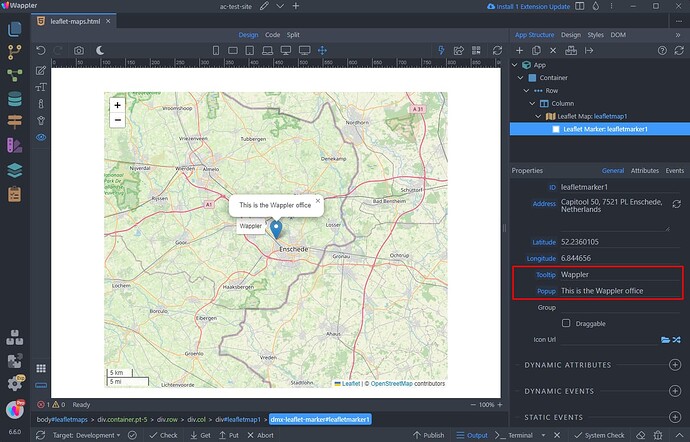
You can add tooltip and popup texts to the marker. The tooltip appears on mouse hover and the popup appears on marker click:
We leave the rest of the options to their default values, as we don't need them right now.
Customizing Markers
You can easily customize your markers - set the color and/or add an icon to them. You use Font Awesome or Bootstrap Icons as marker icons.
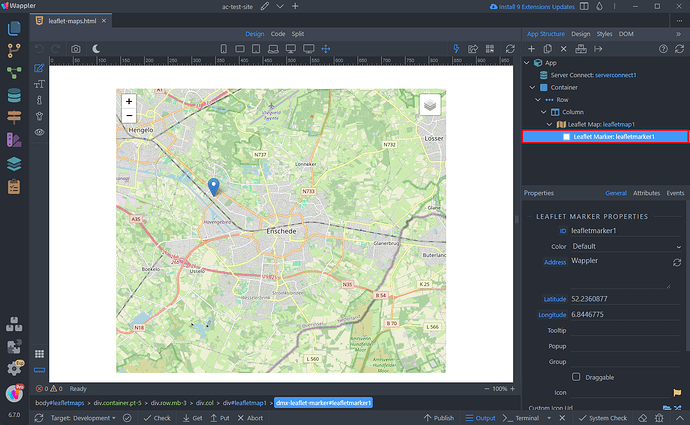
Select your marker:
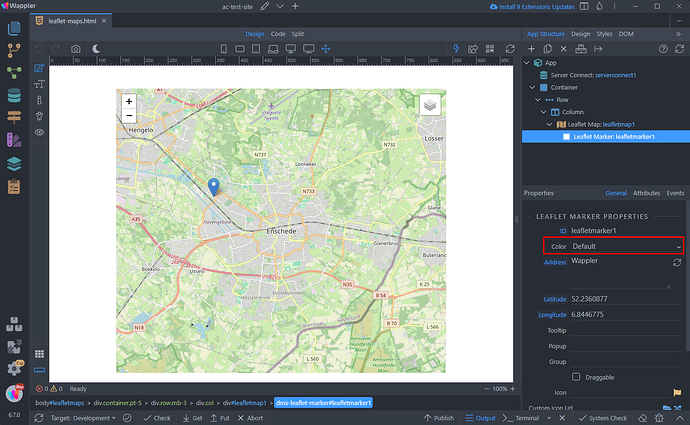
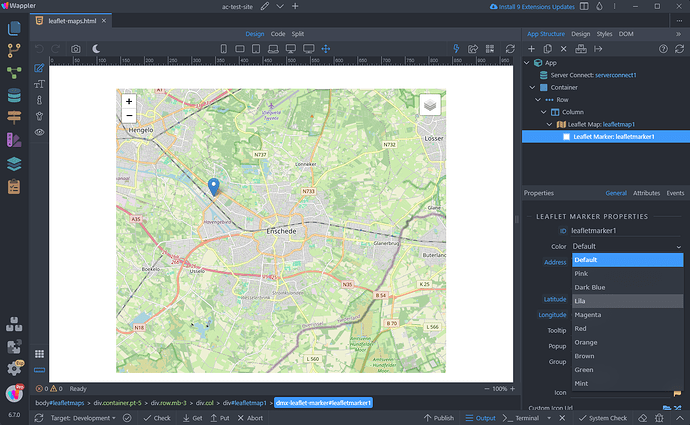
You can change the marker color:
Just pick a color from the dropdown:
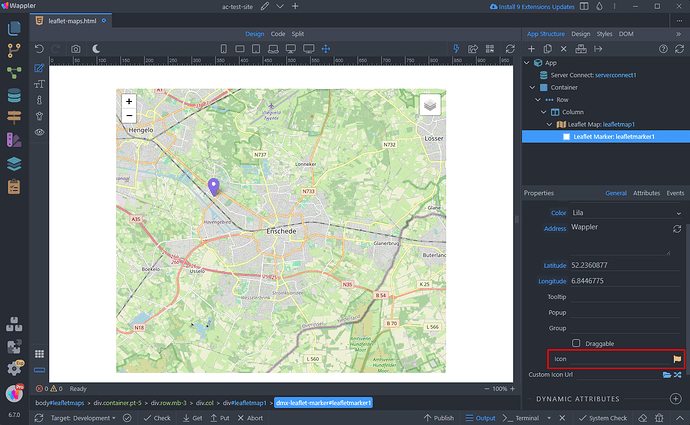
Then you can also add an icon inside the marker. Click the Icon picker:
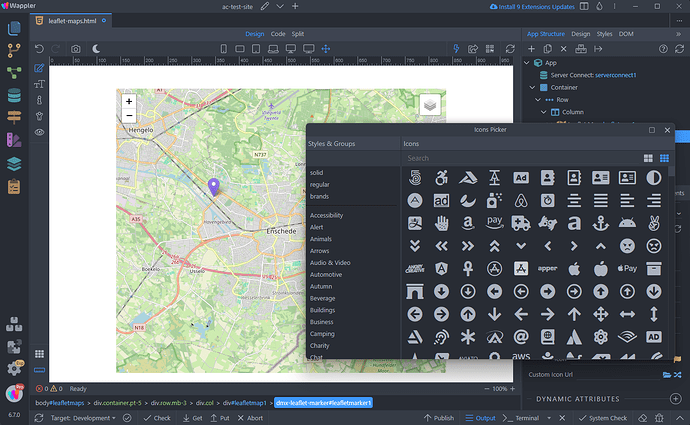
The used icons library will automatically be detected - Font Awesome or Bootstrap icons:
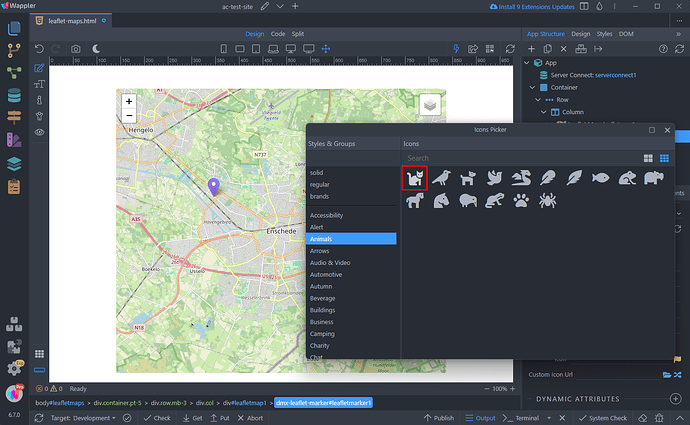
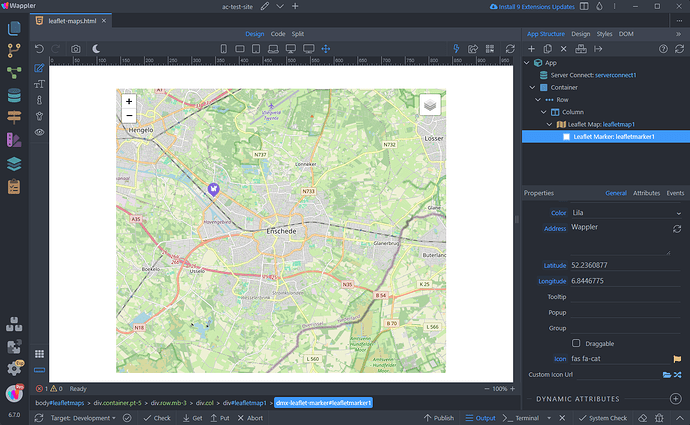
Pick an icon and it will be added to your marker:
And you are done:
Custom Marker Icon
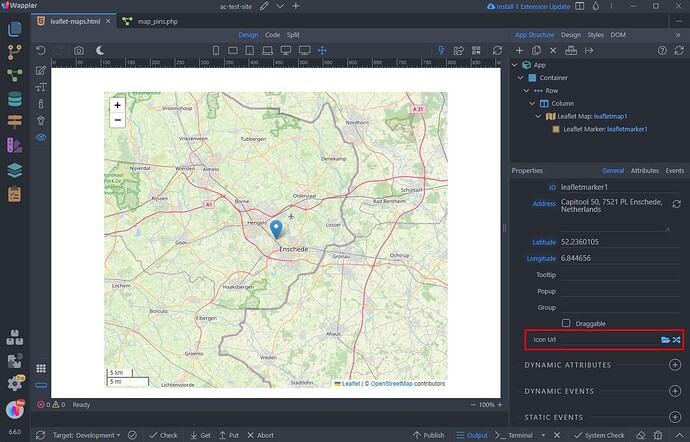
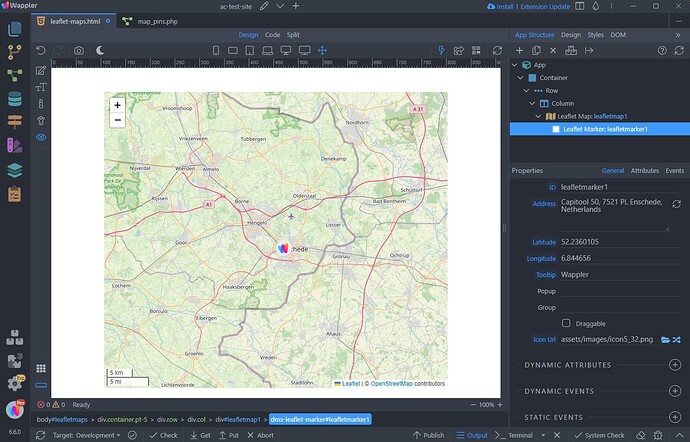
You can easily add a custom icon for your marker. Click the folder icon in order to browse to an image in your project folder:
And select an image. You can see the new icon on the map:
Dynamic Markers
You can also use dynamic markers with the Leaflet Maps. All you need is a data source, which returns the geo coordinates for the markers.
We have an API Action, returning such data:
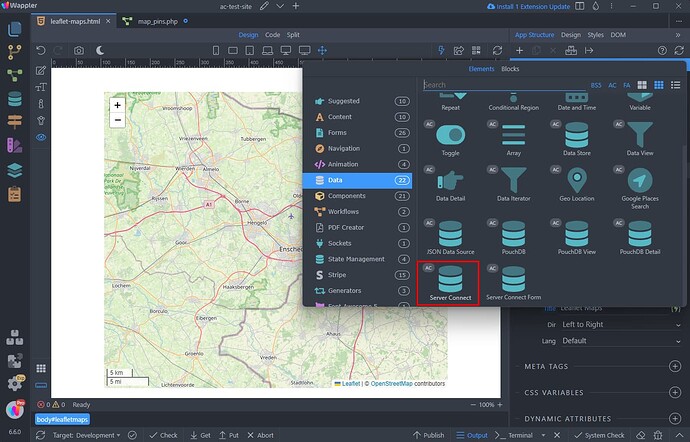
So we need to add the Server Connect component on the page:
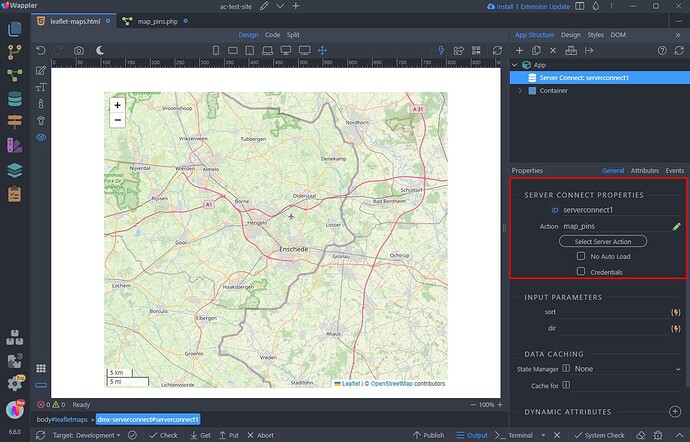
Then select our API Action:
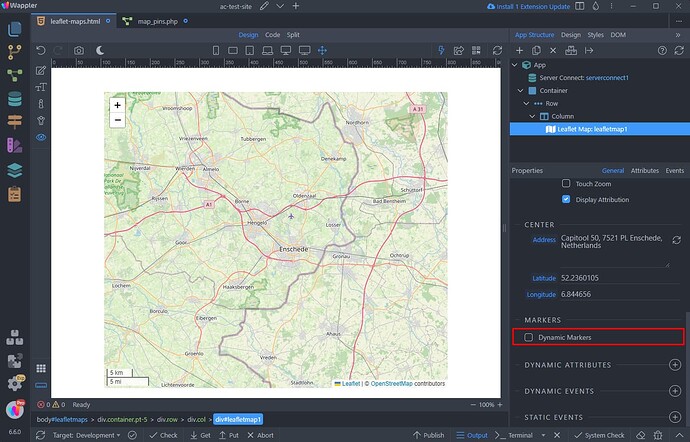
And then we can enable the Dynamic Marker option for the Leaflet Map:
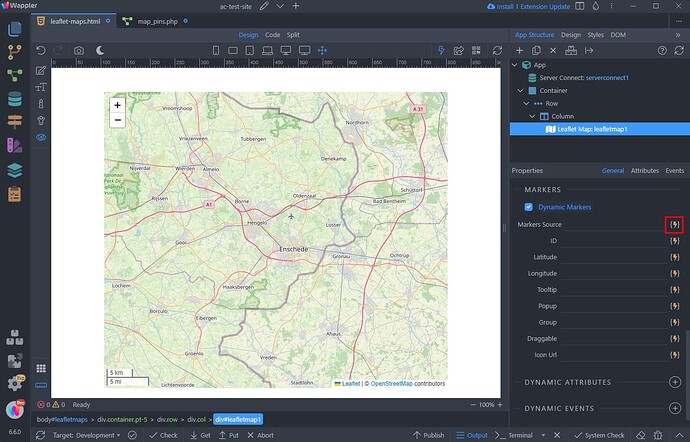
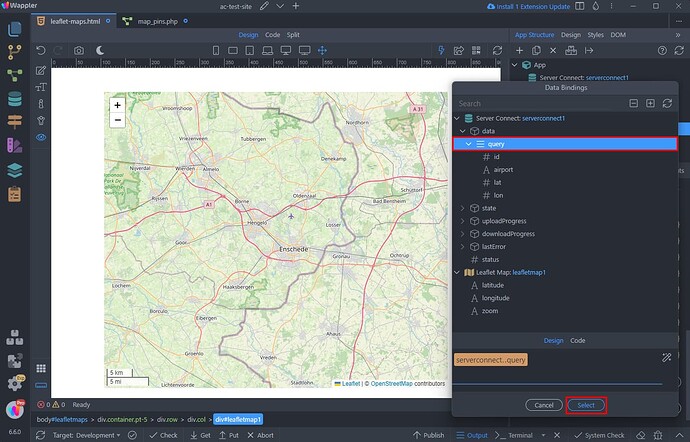
Select the data source for the markers:
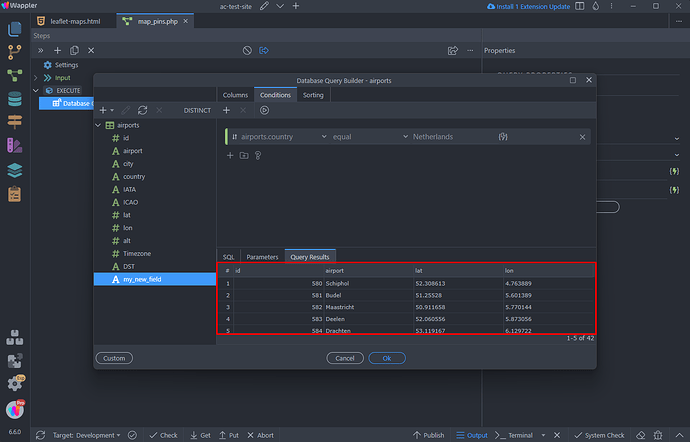
This is our database query:
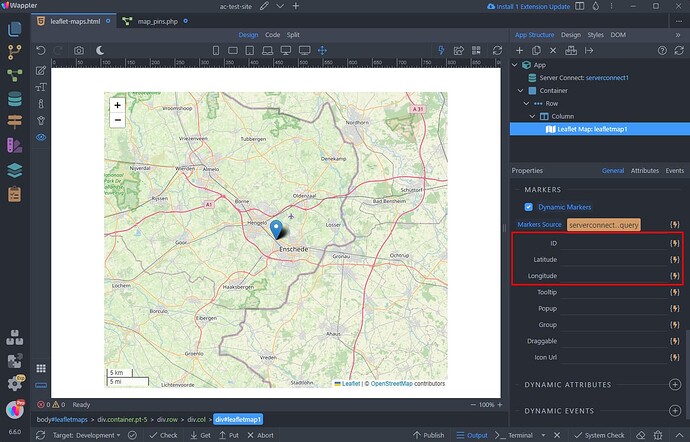
Then select the dynamic bindings for ID, Latitude and Longitude, returned by this data source:
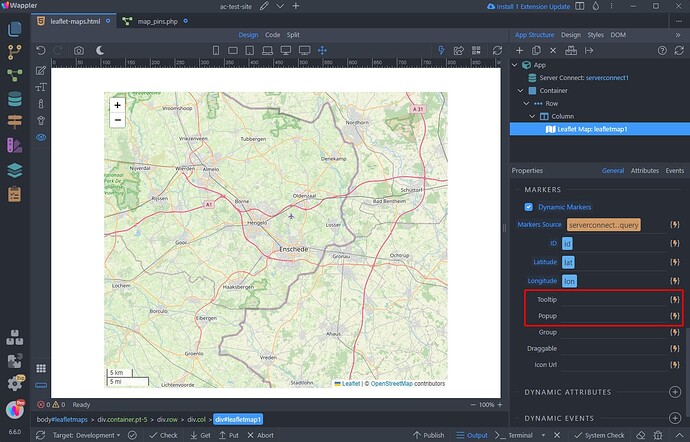
Select dynamic values for the Tooltip and/or Popup if you want to use these:
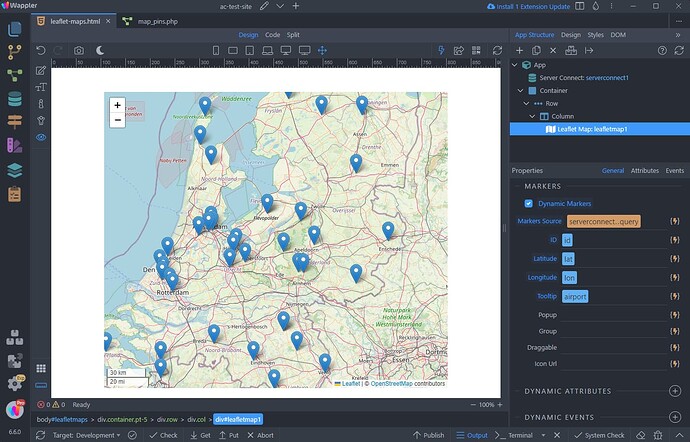
And you are done, the markers are now displayed on the map:
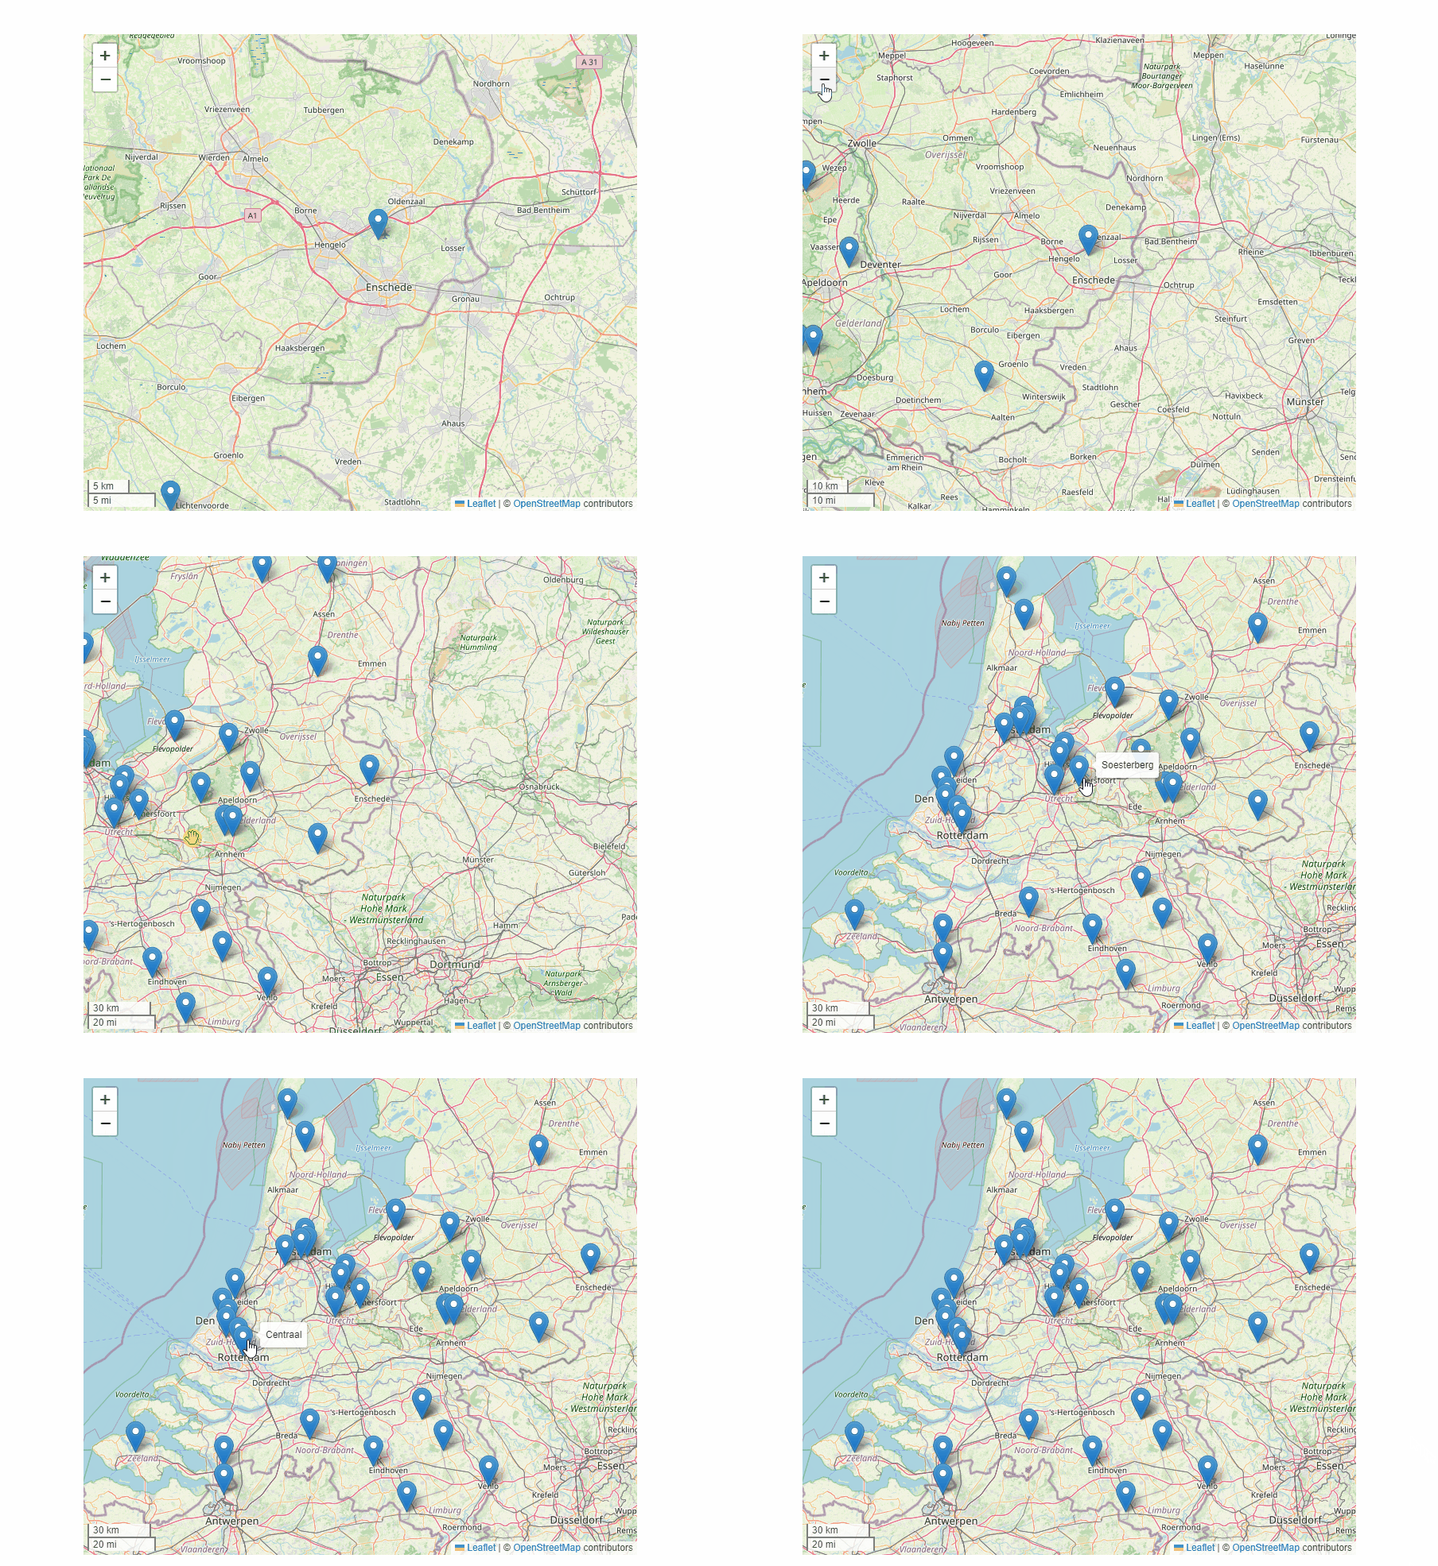
Let's preview the results:
Marker Clustering
When using maps with a large number of markers, overlapping can make the map look cluttered and difficult to interact with, especially when zoomed out. Additionally, the performance of the map can degrade due to the high number of markers. To address this, many mapping applications use marker clustering, which groups nearby markers together at various zoom levels, enhancing both the map's usability and performance.
This is also available in Leaflet Map in Wappler.
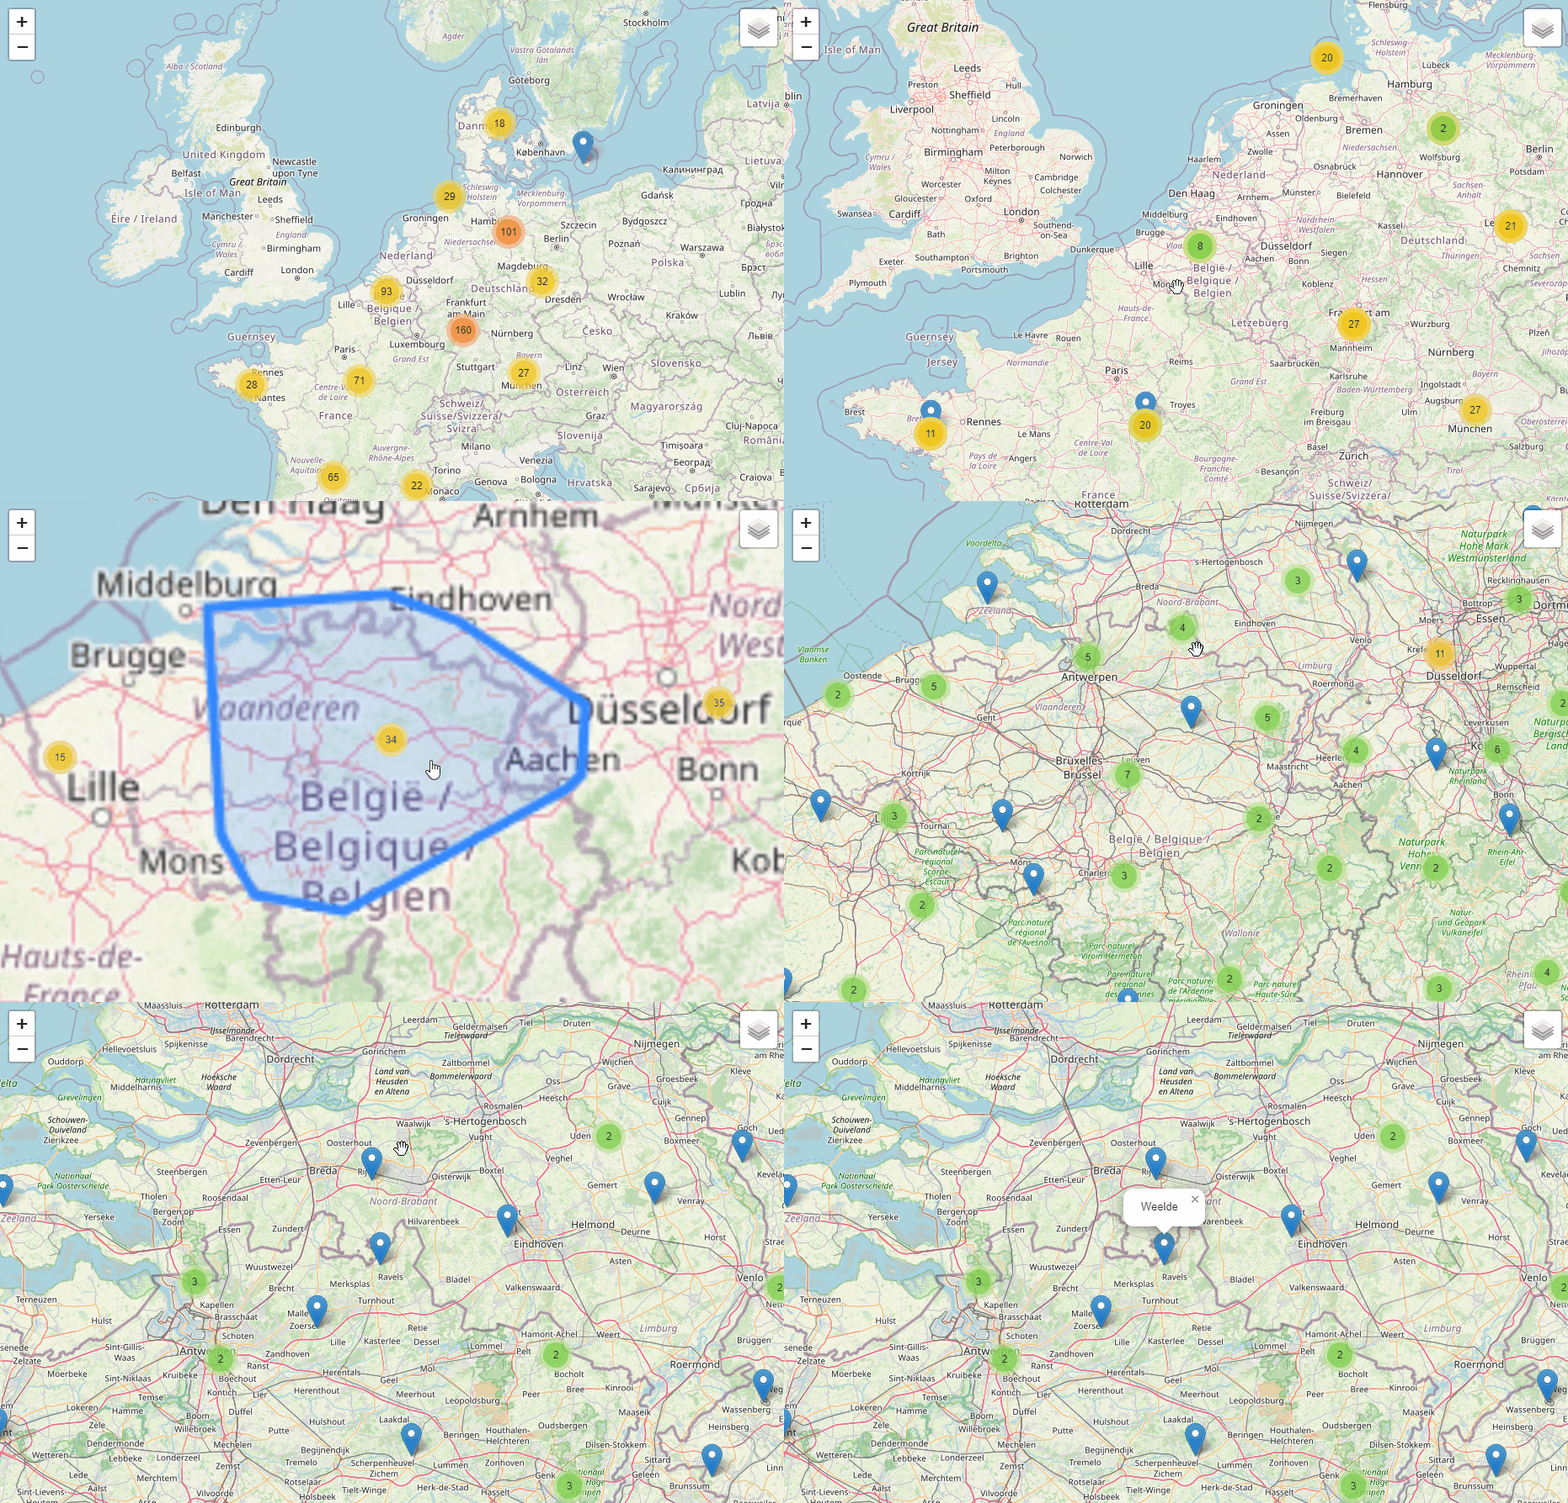
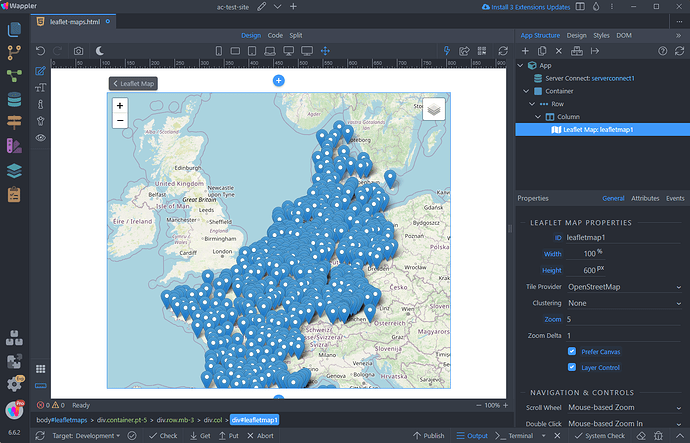
We have a map with hundreds of pins, which overlap and it's difficult to interact with:
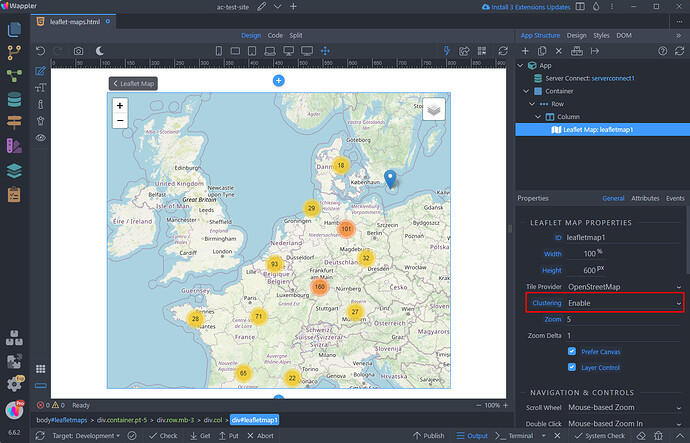
To improve this, we need to enable Clustering in Leaflet Map properties. Set Clustering to Enable:
And you are done, you can see the map looks nicer, with different pins grouped into clusters:
