But I really need some help with this for my project. As mentioned in my previous post, it seems that the AC line chart in wappler does not have functionality to create a linear x axis based on datetime values. The chart only seems capable of plotting points in series as per the data returned from the query.
Does anyone know of any resources that would allow me to utilise charts.js or some thing similar to graph data returned from a wappler database query server action? Is it possible to do this in Wappler does anyone know?
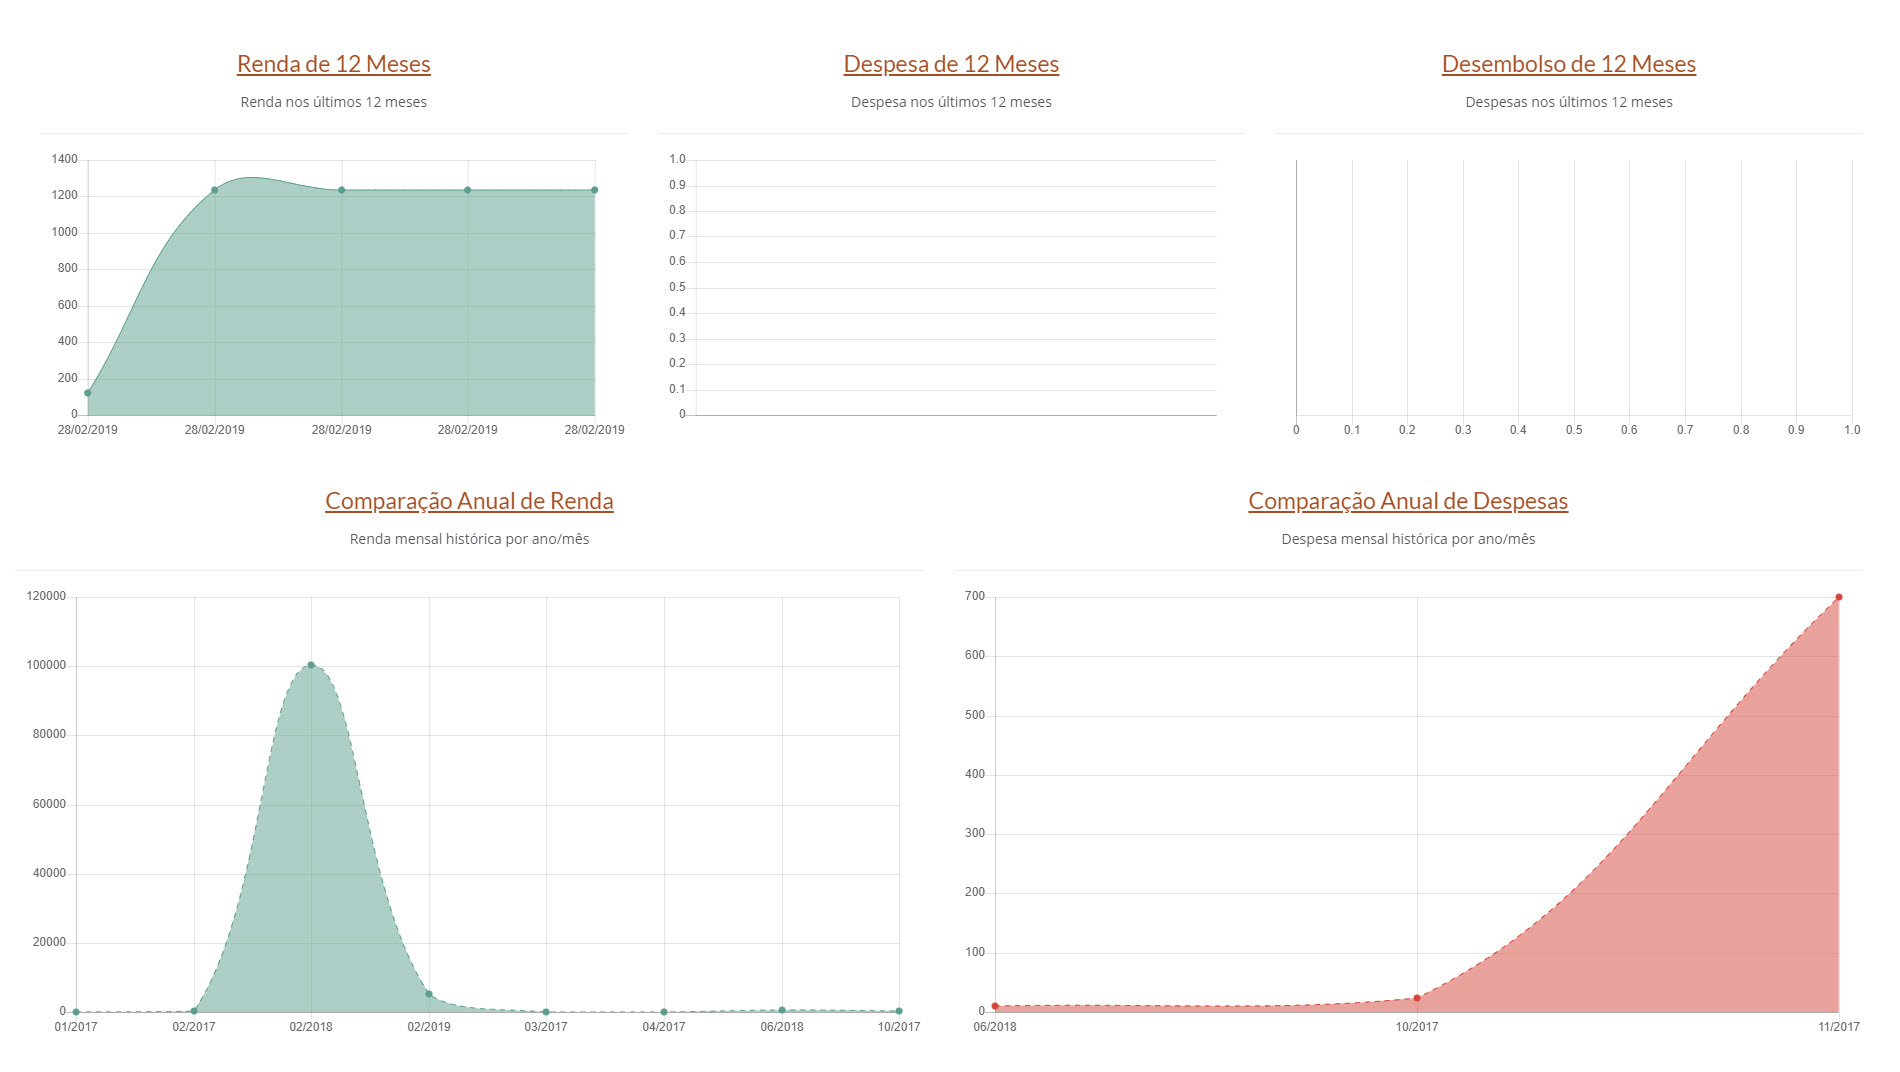
So my issue is illustrated in your bottom right graph. The x axis spacing is not linear. ie. the graph is only displaying the data from the query, and the scale of the x axis is not uniform. You move 4 days between the first and second point and 1 day between the second and third point.
I will look into this, I was hoping that the chart would have the functionality rather then trying to adjust my data. This functionality exists in chart.js charts for example. You simply specify that the x axis should be linear in nature.
I tried implementing as per the link you posted, but I have no way to deal with the null data. It fixes the issues with the x axis, but the null values bring my line chart to zero.
Well they are null in the data query so I guess they should be zero. Is it possible to use alternative charts while using the Wappler queries? Do you know have others done this with Wappler?
I still remain confused as to what you think the chart should do when the date has no data points. Should it not show zero if no data available or what do you expect it to do. Your explanation remains confusing to me.
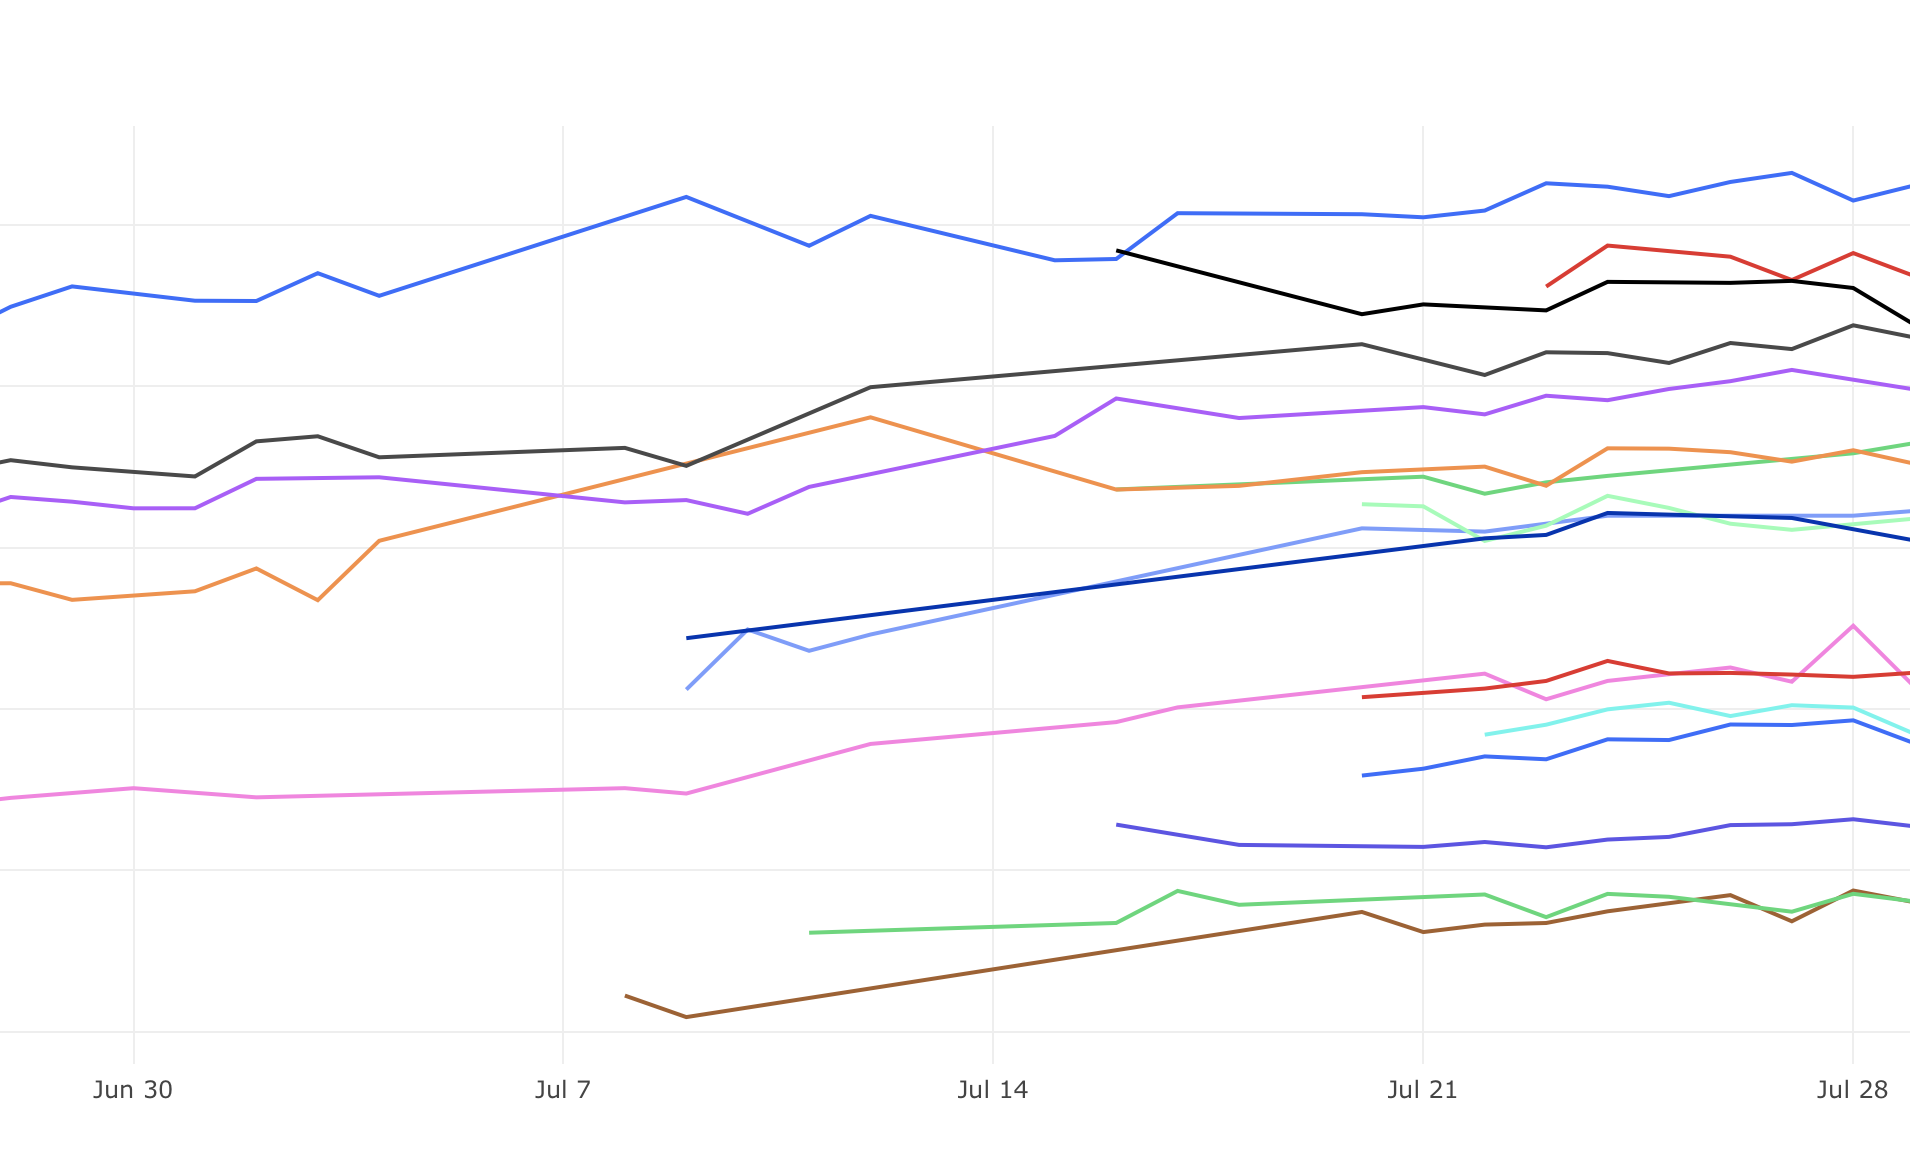
So in the above image you can see the x axis is a DATETIME axis and that it is uniformly distributed, so the vertical gridlines are equally spaced and represent the same interval of time each. This graph was not created in Wappler. This graph was created with data that does not necessarily have a datapoint for each day, but the graph joins the dots when the next data point is recorded.
The next graph was created in Wappler and you can see that Wappler only graphs the data points that exist, which means that the vertical gridlines although equally spaced visually do not represent equal quantities of time. For my particular application, the user is particularly interested in how the data varies over time, ie. the change in slope. But when I graph this in Wappler the visual change in slope doesn’t really tell the right story. As the slope from one point to the next could represent a week or a day. Does this clarify things anymore?
Yes, i get that bit about the axis which can be resolved easily with the right join on a full calendar table in the same manner I suggested with the month/year data points in the post i linked to you
It would be easy to take the min and max dates from the data-set, generate a temporary table of all dates in that range then right join that temp table with the data set to merge the missing dates into the result with null values for those dates
What I am unclear about is what you want the graph to do on those days with zero date i.e. plunge to 0 on the axis for that date or link the dates either side with an appropriate linear slope
So I have actually tried the above. I want the line graph to ignore the null values and act as per my first attached graph in my last reply. That's ultimately my goal.
Sorry, still not actually answering what I am asking clearly, the image you posted does not indicate any null dates so does not show what needs to be done in that case.
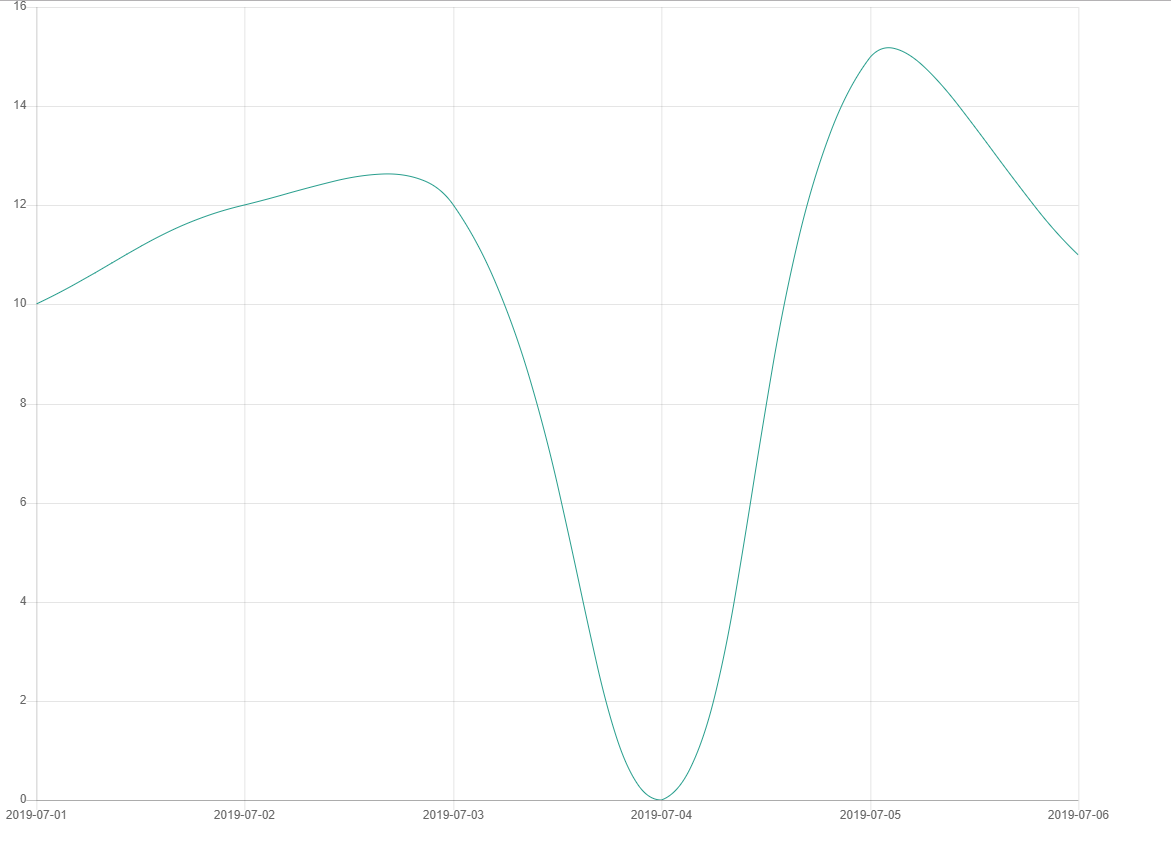
In this example 2010-07-04 has no data
Do you want each line to
A. show no data and drop to 0 on the axis like this
I am no charts.js expert but this does not appear possible with the current component. If you could tell me which charts property you think will achieve this i can look at the possibility of manually binding that property to the chart component but my gut feeling is that this wont work as dmxCharts,js appears to act as an interface to chart.min.js so manually bound properties probably wont be passed though to charts.js at all, they will be ignored
That leaves the alternative of calculating mid points for the missing data which I get the impression you don’t want to do.
Should mention, nothing in wappler prevents you adding your own code to interface with charts.js pr any other .js chart component.
Wappler produces standard HTML/ JS so just add it as you would any other webpage as a custom script section.
Hello @whlrb,
I saw several topics created by you, asking the same question about what you are trying to achieve.
If that’s natively supported in charts.js, then we can add it as an option in the UI in our next updates.
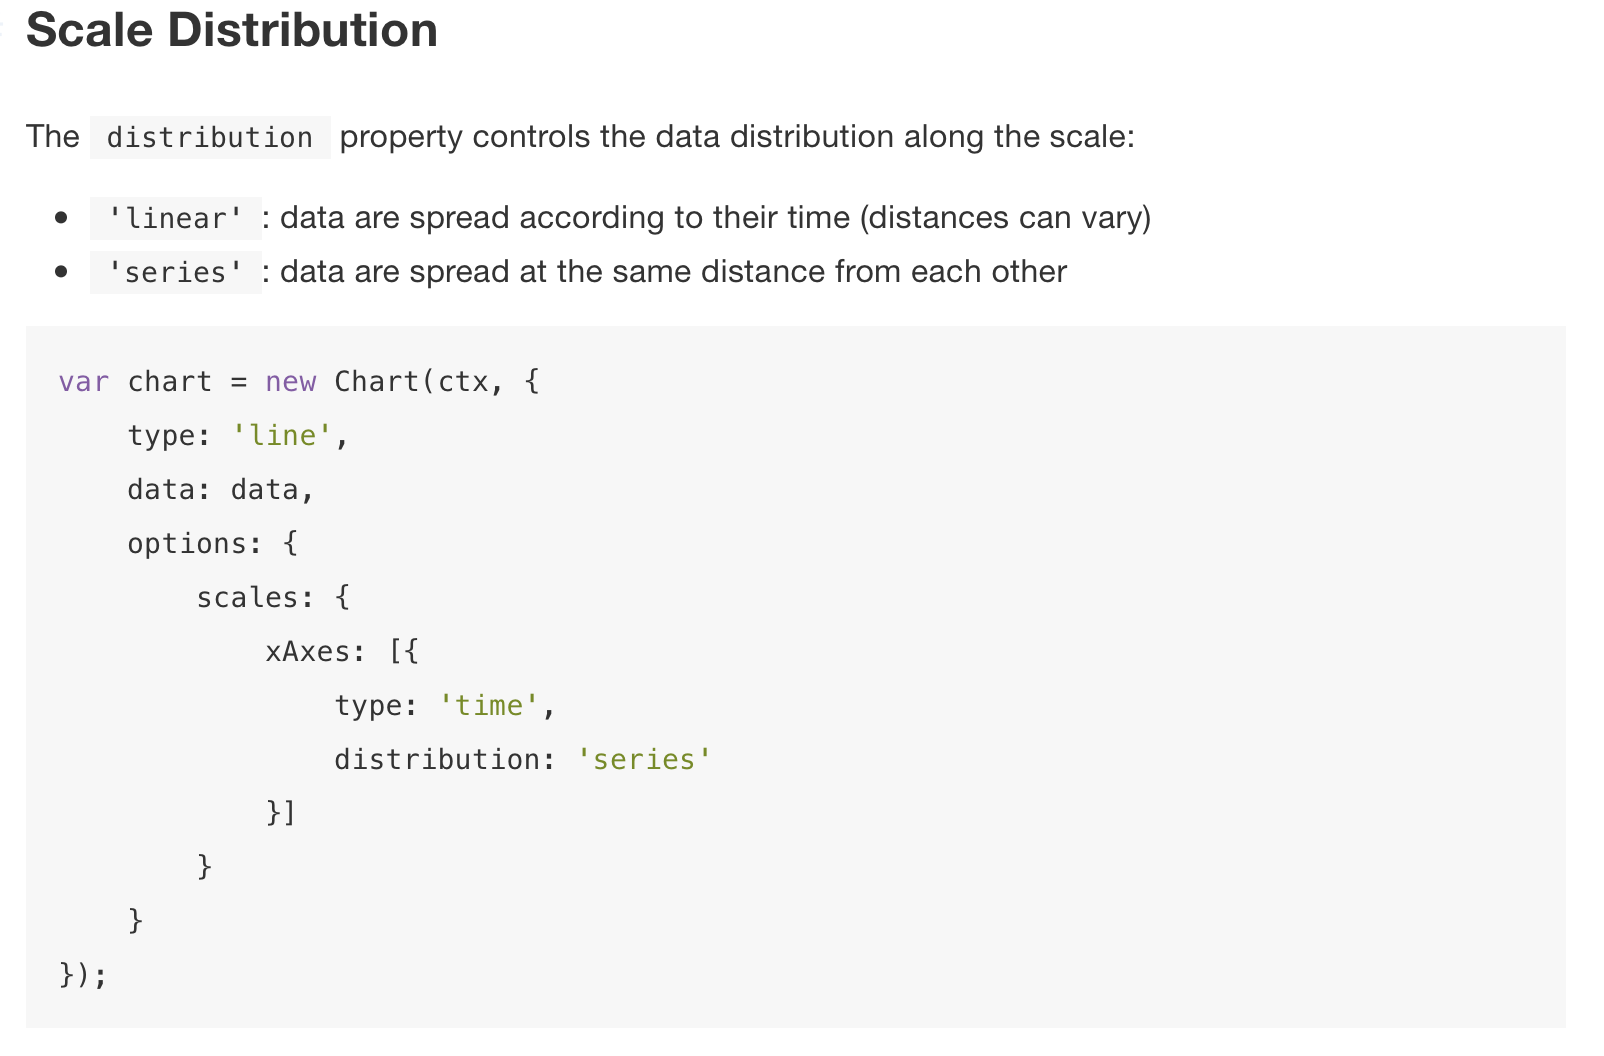
So in charts.js it seems that you just need to specify the axis distribution as linear. I believe this will distribute the axis values uniformly regardless of the presence or absence of data for each division in that axis.
@Teodor That would be brilliant. As mentioned above, I believe it is the linear distribution functionality that I am looking for in the chart. I have also created a feature request on this topic. Apologies for creating multiple topics on the same problem. I'm just under a bit of pressure to create a workaround.
If I was to try and do this in charts.js and looking at the code for my current Wappler graph above, is it possible to hand the data in this . notation format to charts.js? Does anyone have any examples of using data returned from a server connect query in a charts.js chart.
Again thanks for putting time into helping me out with resolving this.
I did look at that possibility but couldn’t get it to work. I think the chart component takes the parameter sent then passes them on to charts.js. However it looks like only the parameters defined within the component are passed through so this may need an update to dmxCharts,js to pass the additional parameters through. Guess that’s one for the developers, you could try a feature request, they tend to be led by those features most voted for
Perfect, I have created a feature request topic anyway. In the meantime I am going to try and see if I can extract the data from my query and feed it in to the chart. Thanks again for your help Brian.