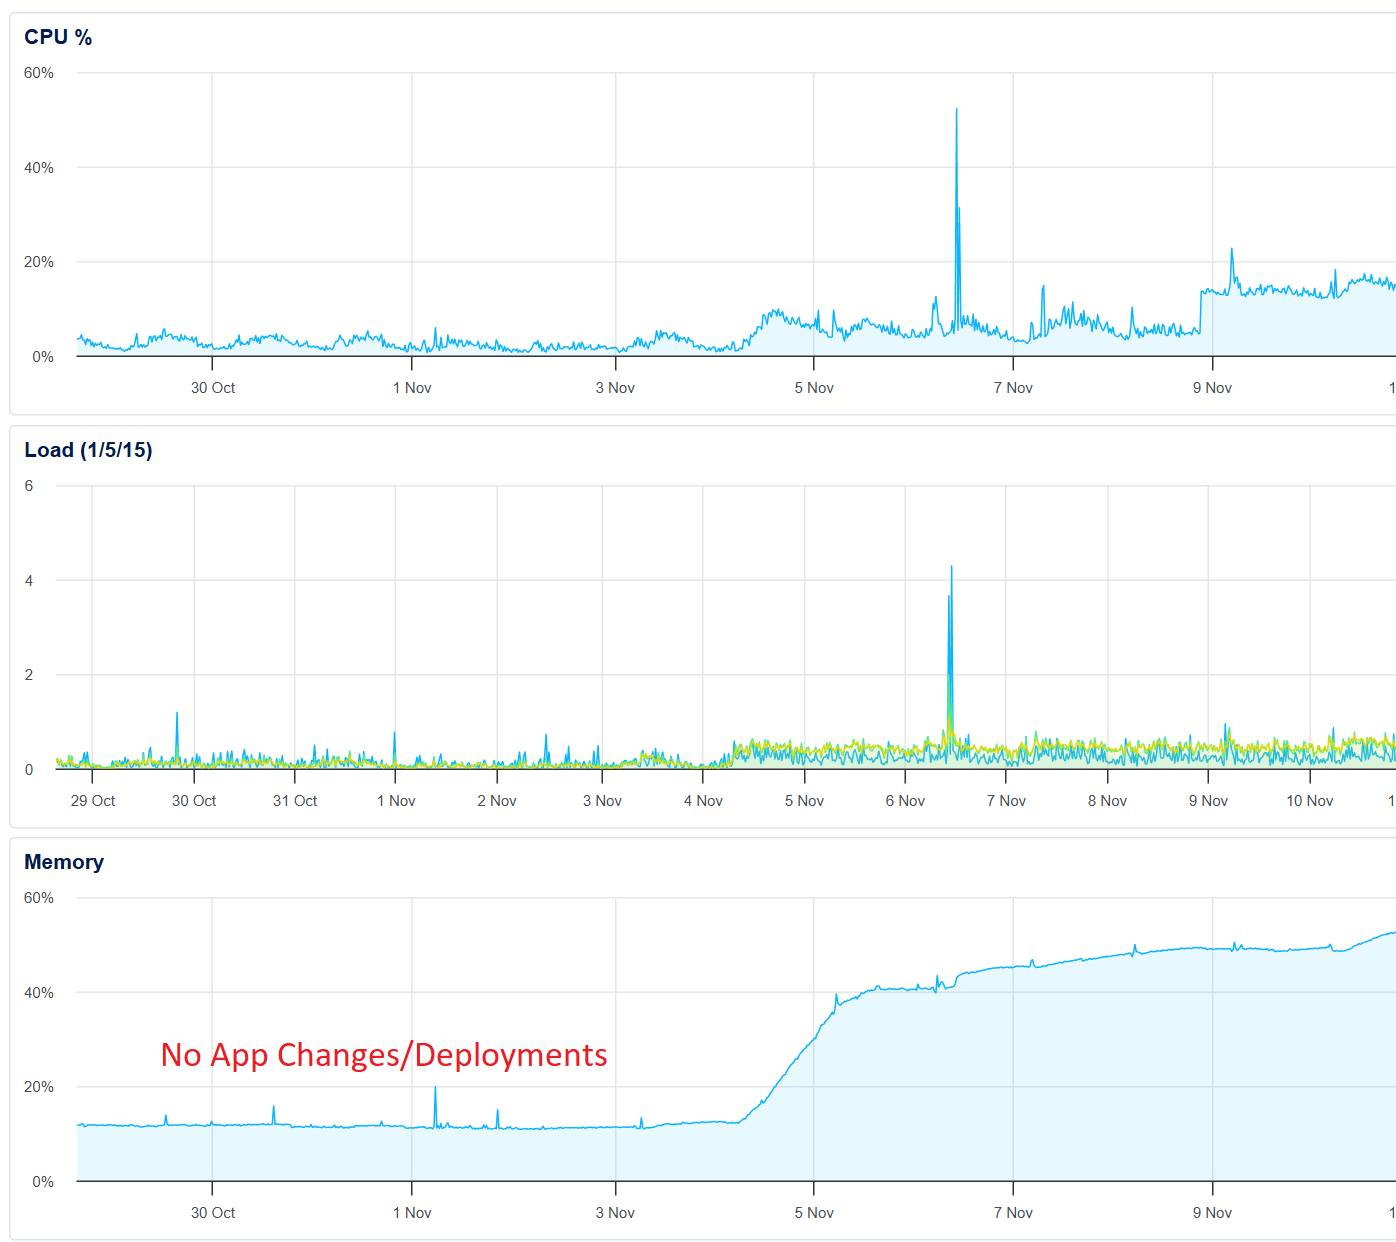
App in production for years, sitting on Wappler version 6.8.0, Node version 16, on a 4CPU x 16GB droplet. DB is hosted separately on Aiven. Droplet CPU utilization sits below 8% during the heaviest of user loads and memory hovers stable at 10% for years. Then suddenly on November 3-4, with no recent code deployments, DB changes, etc memory heap takes off and the CPU has to start sawtoothing the GC.
I attempted a fresh redeploy, which truncated the memory but then it went right back to climbing at the same rate.
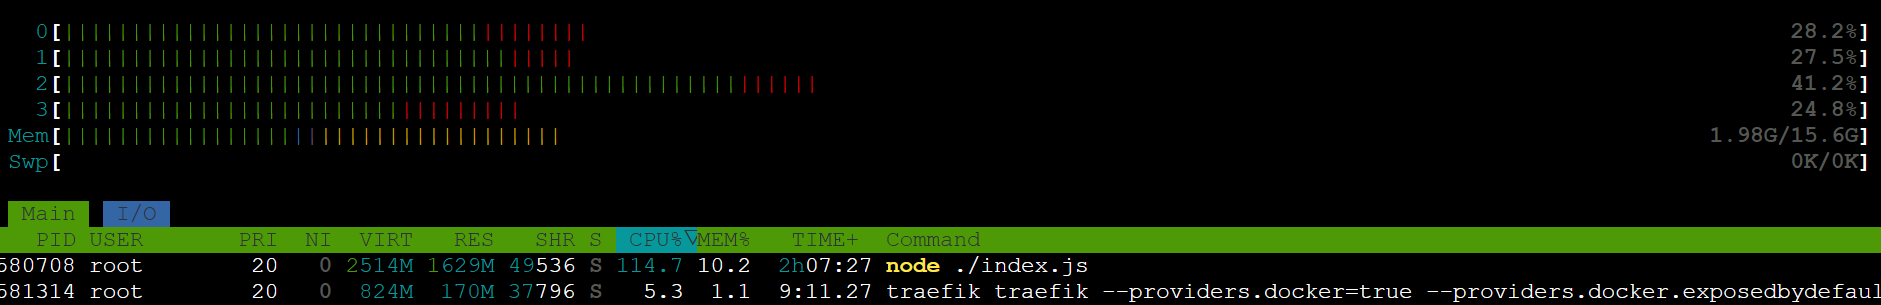
The cause looks like the FDs in the container are climbing. So far, GPT is just guessing that connection management is now gone awry (due to a dependency updating somewhere). Before I start randomly building custom routes to stub functionality, I was wondering if anyone had experienced this behavior before and what they did to circumvent and/or any other recommendations. Thanks all!
If you need more information about what is going on inside the app, I know there are some other tools like Sentry performance, or Datadog APM but not familiar to me..
Maybe someone else can join here and share some info, sorry for not being so helpful
Thanks again. Unfortunately Netdata only revealed to me what was already apparent: huge GC heap sweeps every few minutes from Node.
The root question remains: somehow on the server, Node suddenly started leaking per-request/per-connection memory and sockets, causing the heap and RSS to grow until GC runs hard every few minutes (but memory utilization still grows out of control). If anyone’s got experience with this, I’m all ears!
It is strange that it just suddenly happens, if it was a memory leak in the code you probably would have noticed it sooner and it wouldn't just happen on a single day.
Check if you have any server logs from November 4 to see if you notice something strange in them. Perhaps a suspicious upload or strange requests to your server.
Debugging can be difficult, you can run node with --inspect and connect with devtools to the remote server. It is recommended not to open the debugging port publicly but instead connect using ssh.
And also update Node from 16 to v20. After redploy, CPU GC thrashed and memory climbed as seen, but upon reaching that 75% limit, everything went calm memory stabilized, and CPU throttles down to half of the new thrash level. So I’m now stable. Hence it was not a memory leak but rather GC suddenly going nuts + not having a clear memory max defined.
The mystery still remains on what suddenly caused the old/young-gen space to be insufficient, I added a custom route in order to log all API response times to docker logs, but all looked normal. According to GPT, it can be something as benign as a cloudflare or DB external adjustment that holds on to connections for simply an extra 50ms, in order to trigger young-gen to be insufficient for the stock NODE memory space settings.