How to use Group By in chart

I have a requirement to display a chart that group records daily so i will have the sum value of column daily.
in mySQL i use something like this

SELECT    DATE(datetime) as DATE, SUM(`count`) totalCOunt
FROM      tableName
GROUP BY  DATE(datetime)

how can i do this in wappler?

Hello @mrbdrm
create view in mysql then use it in wappler …

1 Like

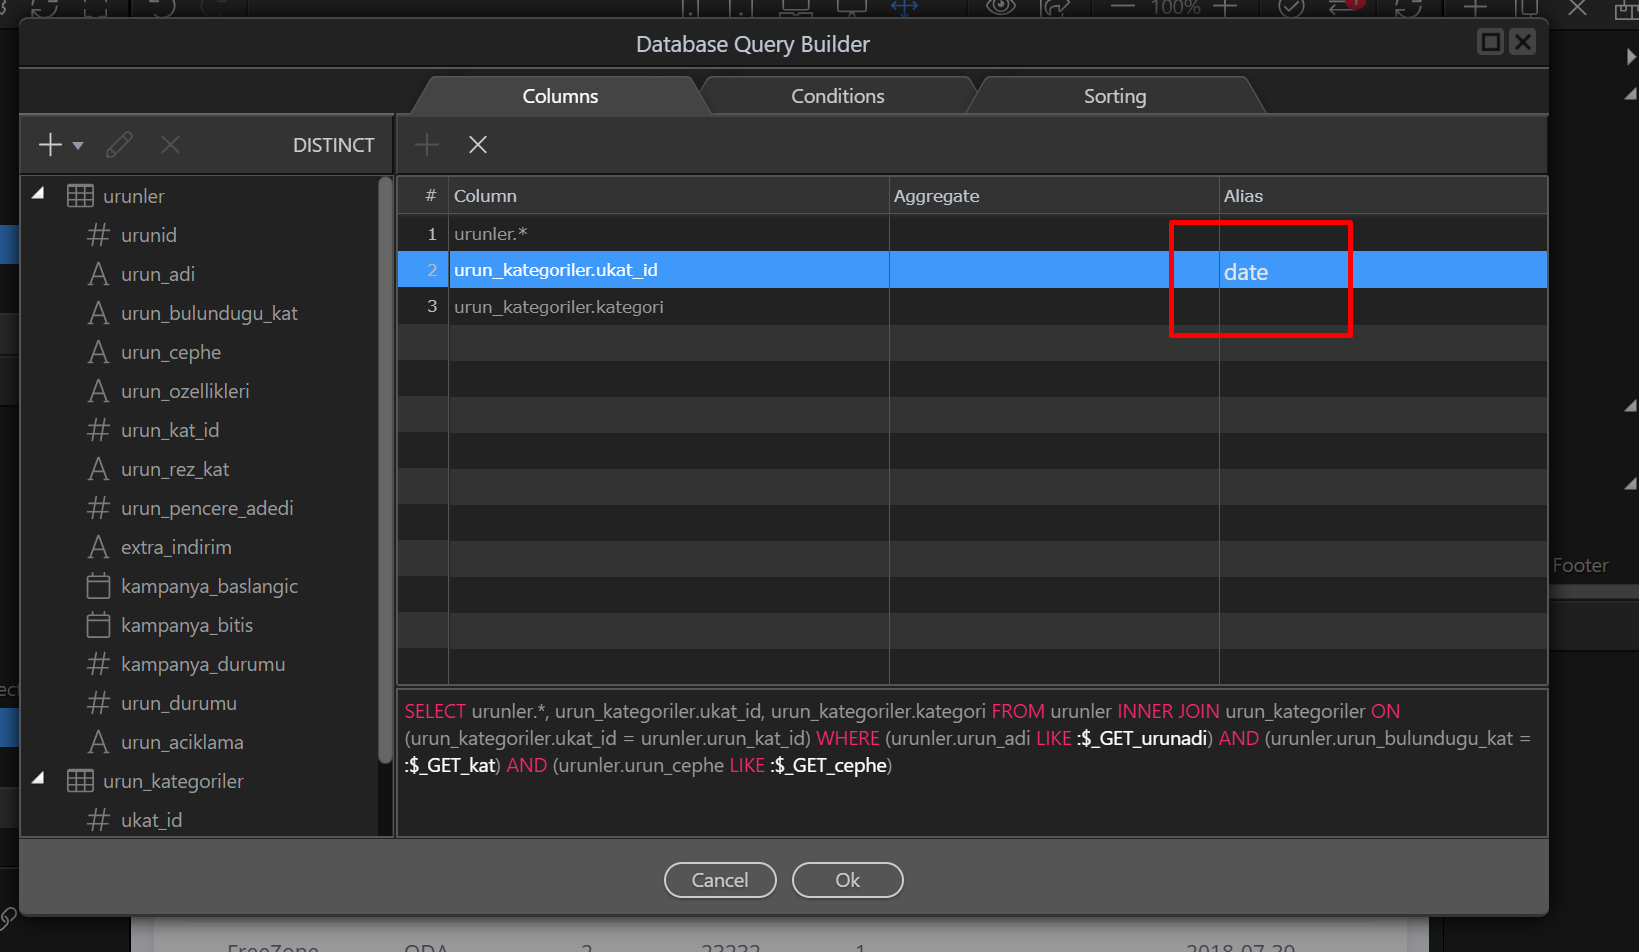
Just beat me to it! @s.alpaslan, seems the only obvious solution. We really need a picker or dropdown in the query builder to allow us to apply a SQL function to a field as it’s a big omission. Also would be nice to have access to queries as well as tables and views

1 Like

yeap @Hyperbytes … but you can create this query in wappler too …
and you can sum and count it in wappler … I think you want to more easy database query builder qui . If I understand you right. :))

yes thats simple enough but how do you apply the date() function to the datetime field, that’s the issue or am i missing something obvious

it is not date function it is only allias @Hyperbytes

select date(datetime ) — can use dateformatter then use allias

He is converting the datetime (which i assume is type datetime) to a date only with DATE(datetime) as DATE and aliasing as DATE surely?

I must be missing something obvious, i don’t see a formatter in the query builder?

if he wants to mysql view … he can use all mysql functions in mysql view but if he dont want to use mysql view and he wants to only wappler functions … @mrbdrm have to format it in wappler

yeap … there arent formatters in query builder.

Which goes back to my original comment, we need that functionality in Wappler (and queries access with parameters if possible)

yeap …good feature request :+1:

this is temp solution

but this query will not work in chart…

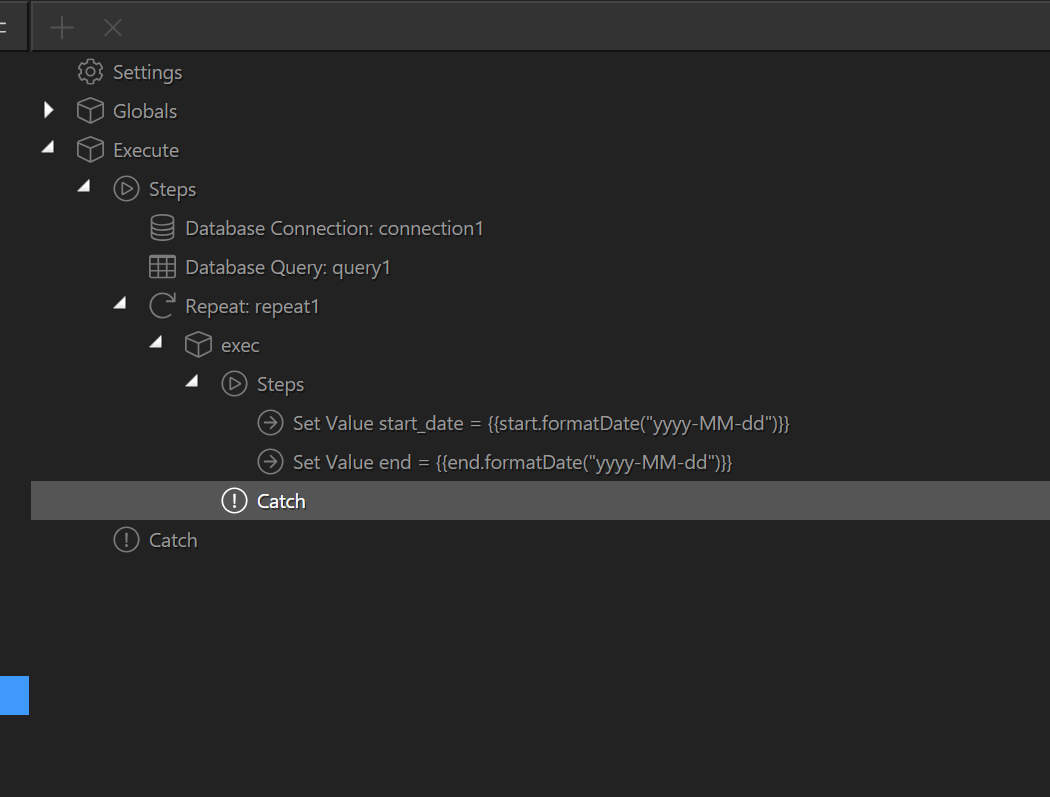
I don’t know how, because I haven’t done it yet. But when you add a repeat to a page, and go to expression, choose your query, and then click the magic wand ----- you have Collections -> Group By. I believe this would be on expressions for other things too. I think the trick would be to figure out how to use this in conjunction with your query.

There is no repeat in the chart.

1 Like

What happens if you click on the chart’s data source, and click the magic wand and do that?

that what i was thinking too. i will give it a shoot

Added ability to apply a function to a field in query builder as a feature request for anyone interested.

nothing show on the chart if i use group by. no matter what i use to group by.

1 Like

That worked on dmx-zone plugin for repeat. I don’t understand why it wouldn’t work on this. I couldn’t get it to work either. Because I don’t have your data or can see what you’re doing. When you just use count and DATE as the alias, what does the chart do? And what should it be doing that that isn’t doing?