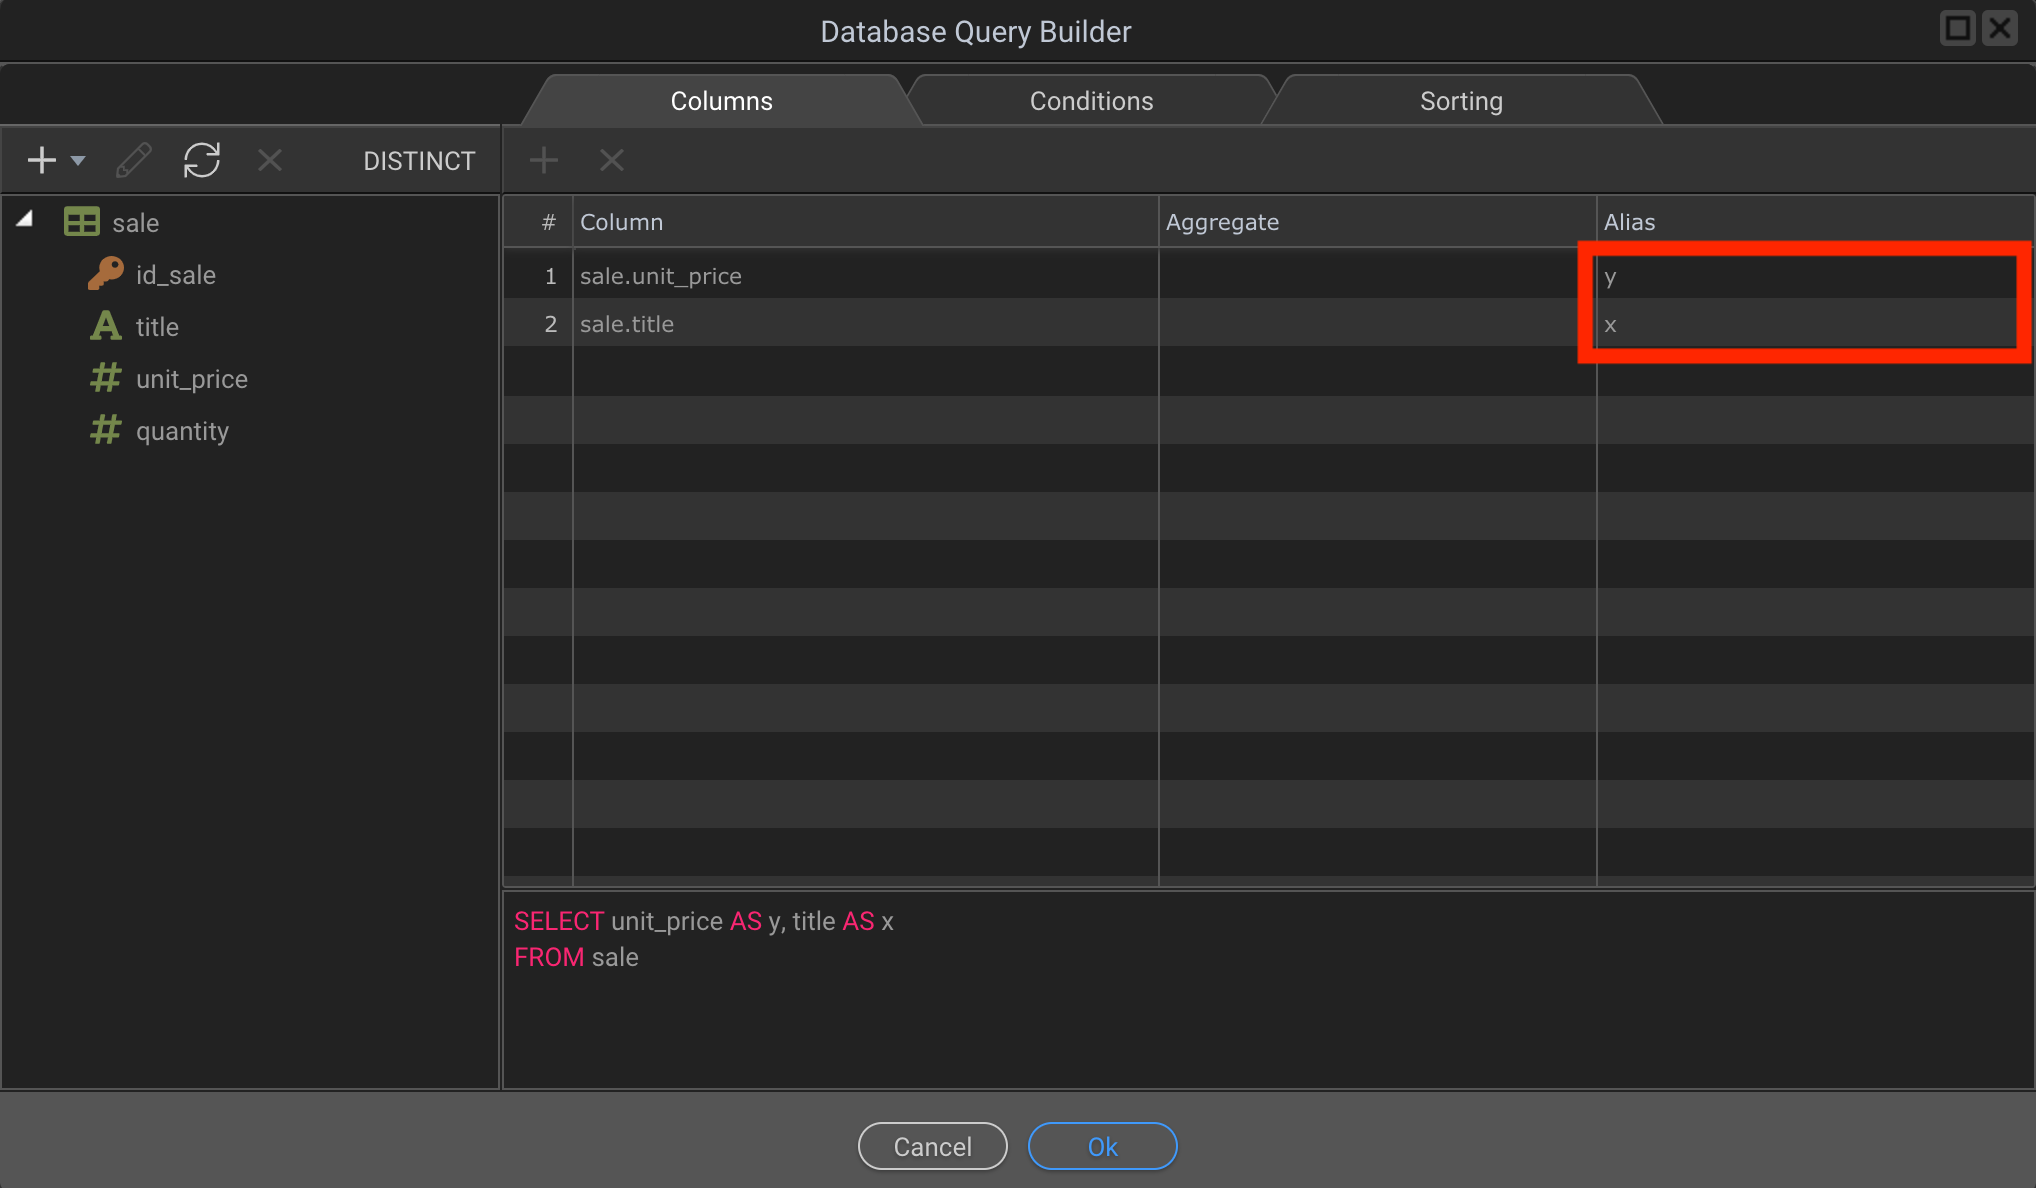
Hi @jellederijke sure no problem, the first thing you have to do is create a server action that returns the two variables that your chart will use in this way:
It is very important that you write as aliases to your two variables x and y because this way the script will be able to read which values of the array go on which axis.
Then in the frontend you create a serverconnect that calls the action before created:
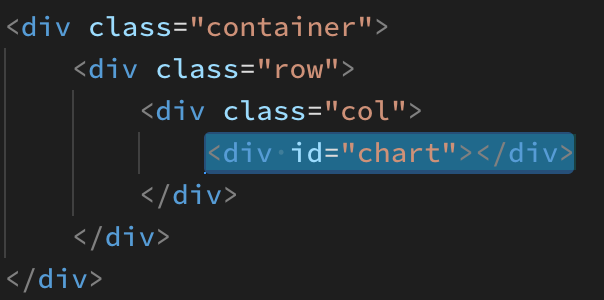
Then you create a div and give it the name you want, later you must add this name in the script of your chart.
Then you can add the script that I put below inside your page or create a new js file and include it.
<script>
var options = {
chart: {
locales: [{
"name": "es",
"options": {
"toolbar": {
"exportToSVG": "Descarga SVG",
"exportToPNG": "Descarga PNG",
"exportToCSV": "Descarga CSV",
"menu": "Menu",
"selection": "Selección",
"selectionZoom": "Selección Zoom",
"zoomIn": "Acercar",
"zoomOut": "Alejar",
"pan": "Mover",
"reset": "Resetear zoom"
}
}
}],
defaultLocale: "es",
height: 350,
type: 'line',
},
dataLabels: {
enabled: false
},
series: [],
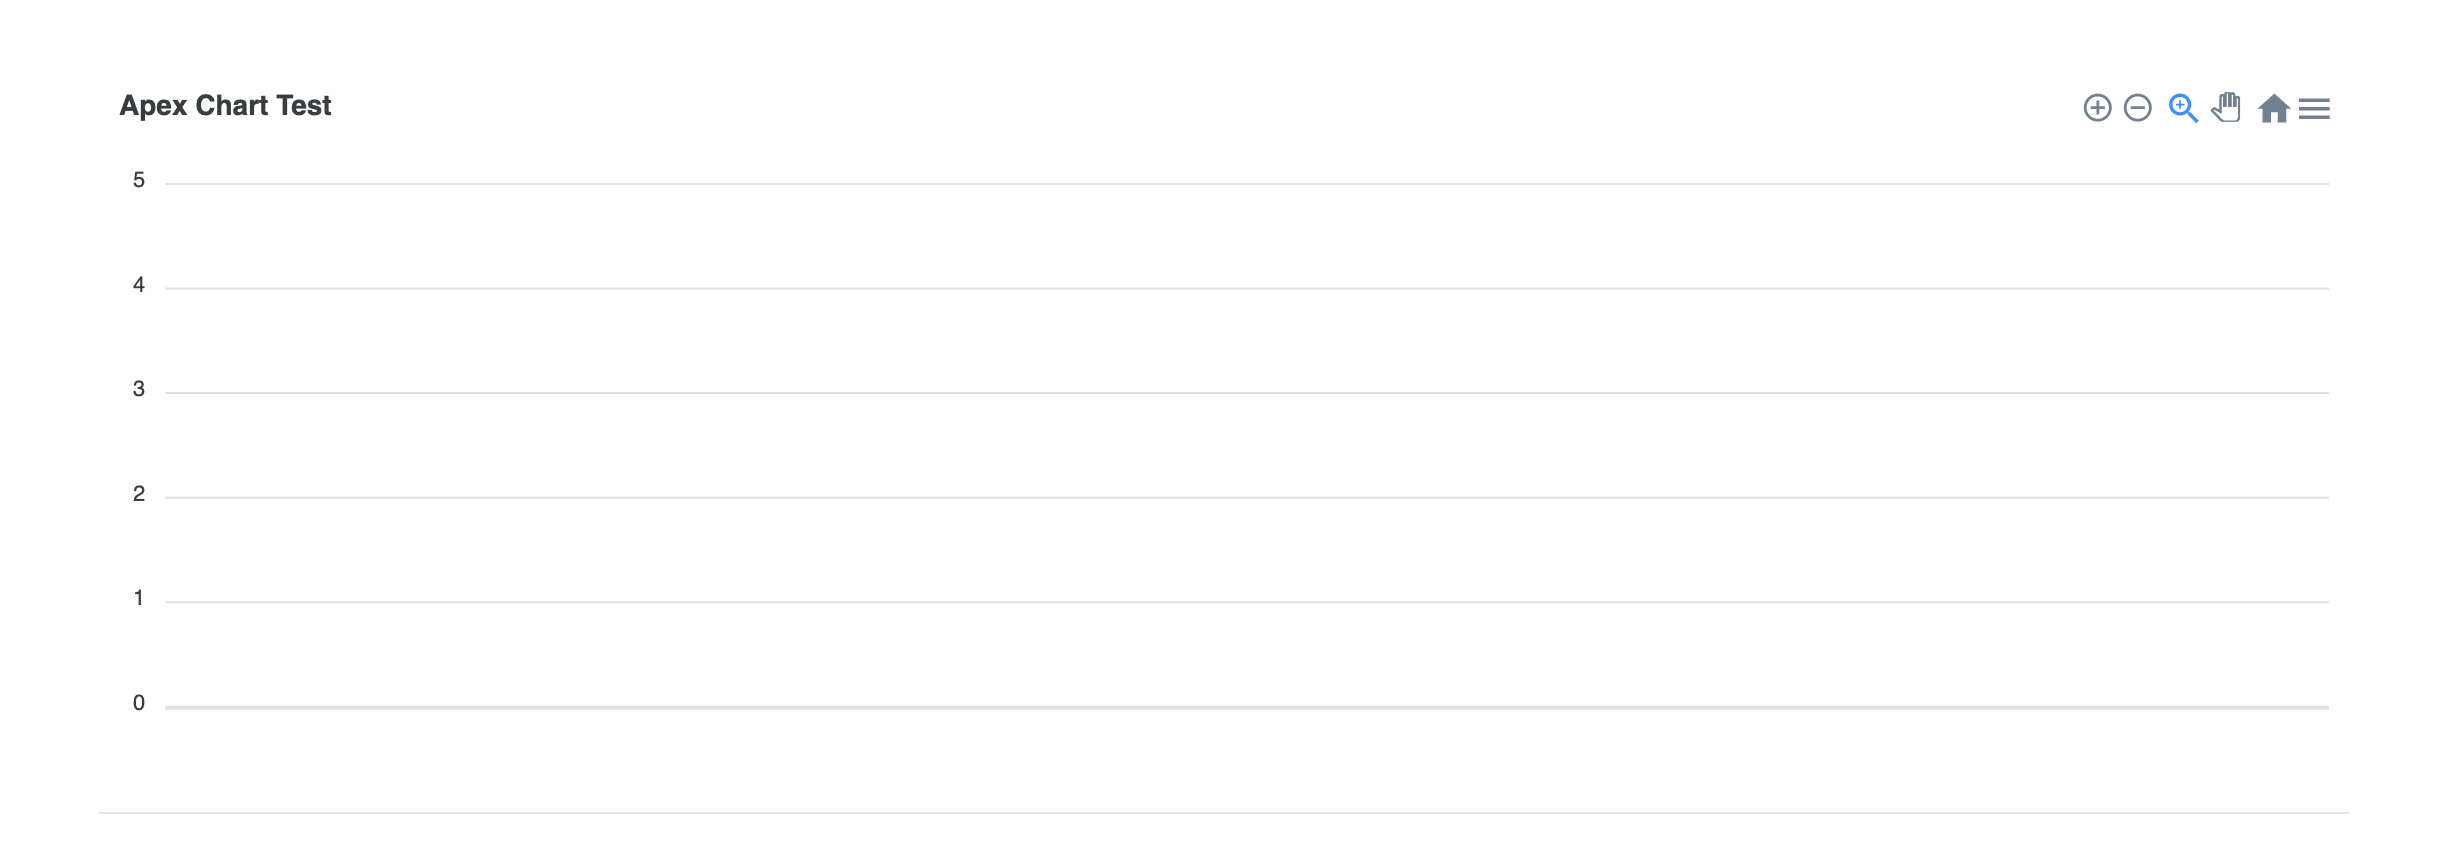
title: {
text: 'Apex Chart Test',
},
noData: {
text: 'Loading...'
}
}
var chart = new ApexCharts(
document.querySelector("#chart"),
options
);
chart.render();
function chartUpdate() {
chart.updateSeries(
[{
name: 'Cost',
data: dmx.parse('serverconnect1.data.query1')
}]
)
};
</script>
Of course you can put the buttons you want above and change the names, for example to export in svg, png, etc., mine is in Spanish. It’s all in the documentation.
The most important part of the code is here, because it is where you pass the array of values that you bring from your database, api or whatever you are using.
var chart = new ApexCharts(
  document.querySelector("#chart"),
  options
);

chart.render();

function chartUpdate() {
    chart.updateSeries(
        [{
            name: 'Cost',
            data: dmx.parse('serverconnect1.data.query1')
        }]
    )
};
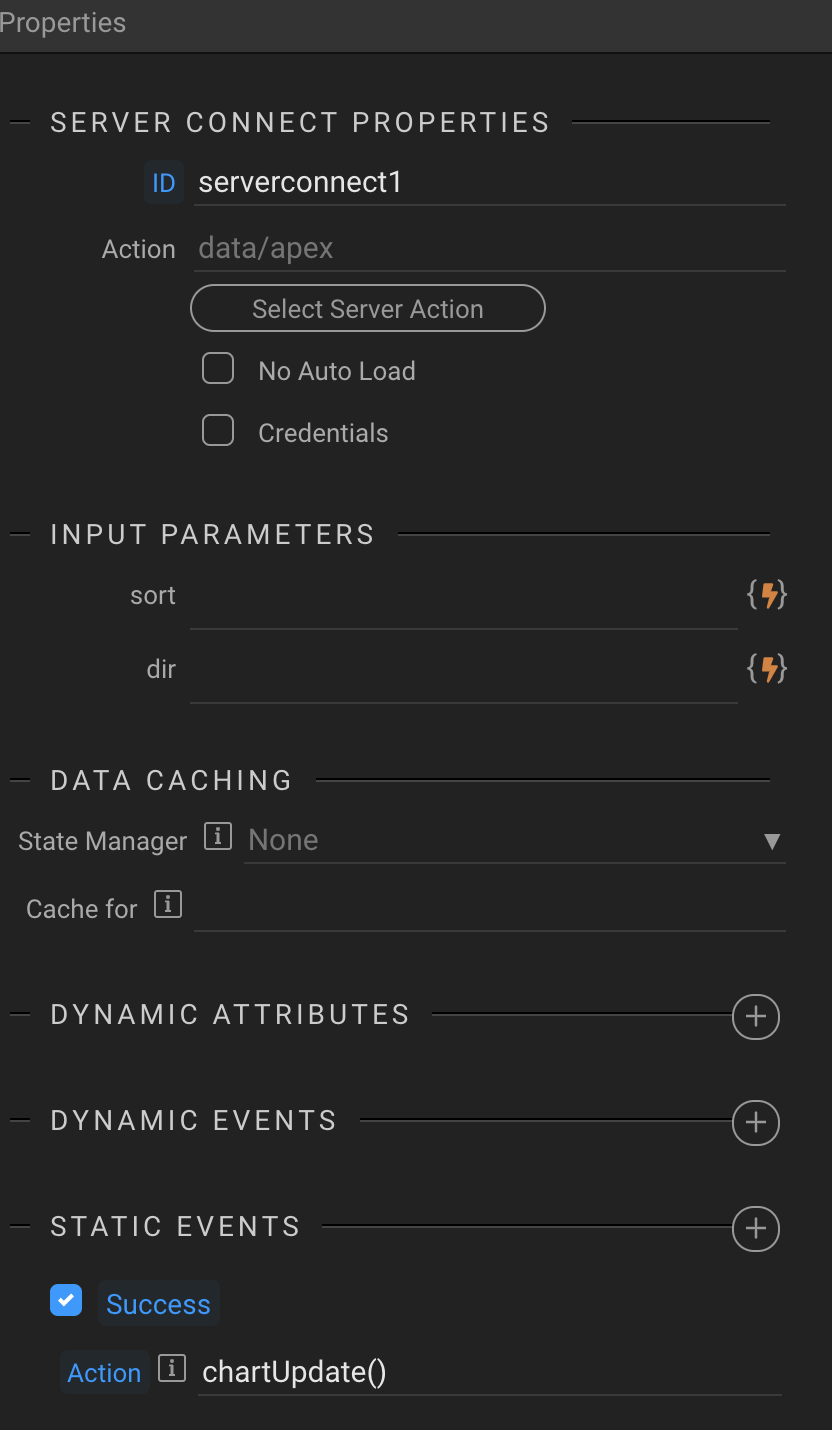
Finally it is very important that you load this script after the data has been uploaded to your site otherwise the chart will not work.
You can call the function in several ways, for example when a button is pressed, but it is best to do it from the serverconnect that you created since in this way every time you load the graph it will be rendered again with the updated values.
To achieve this you just create a static event and call the created function, in this case it is chartUpdate ()
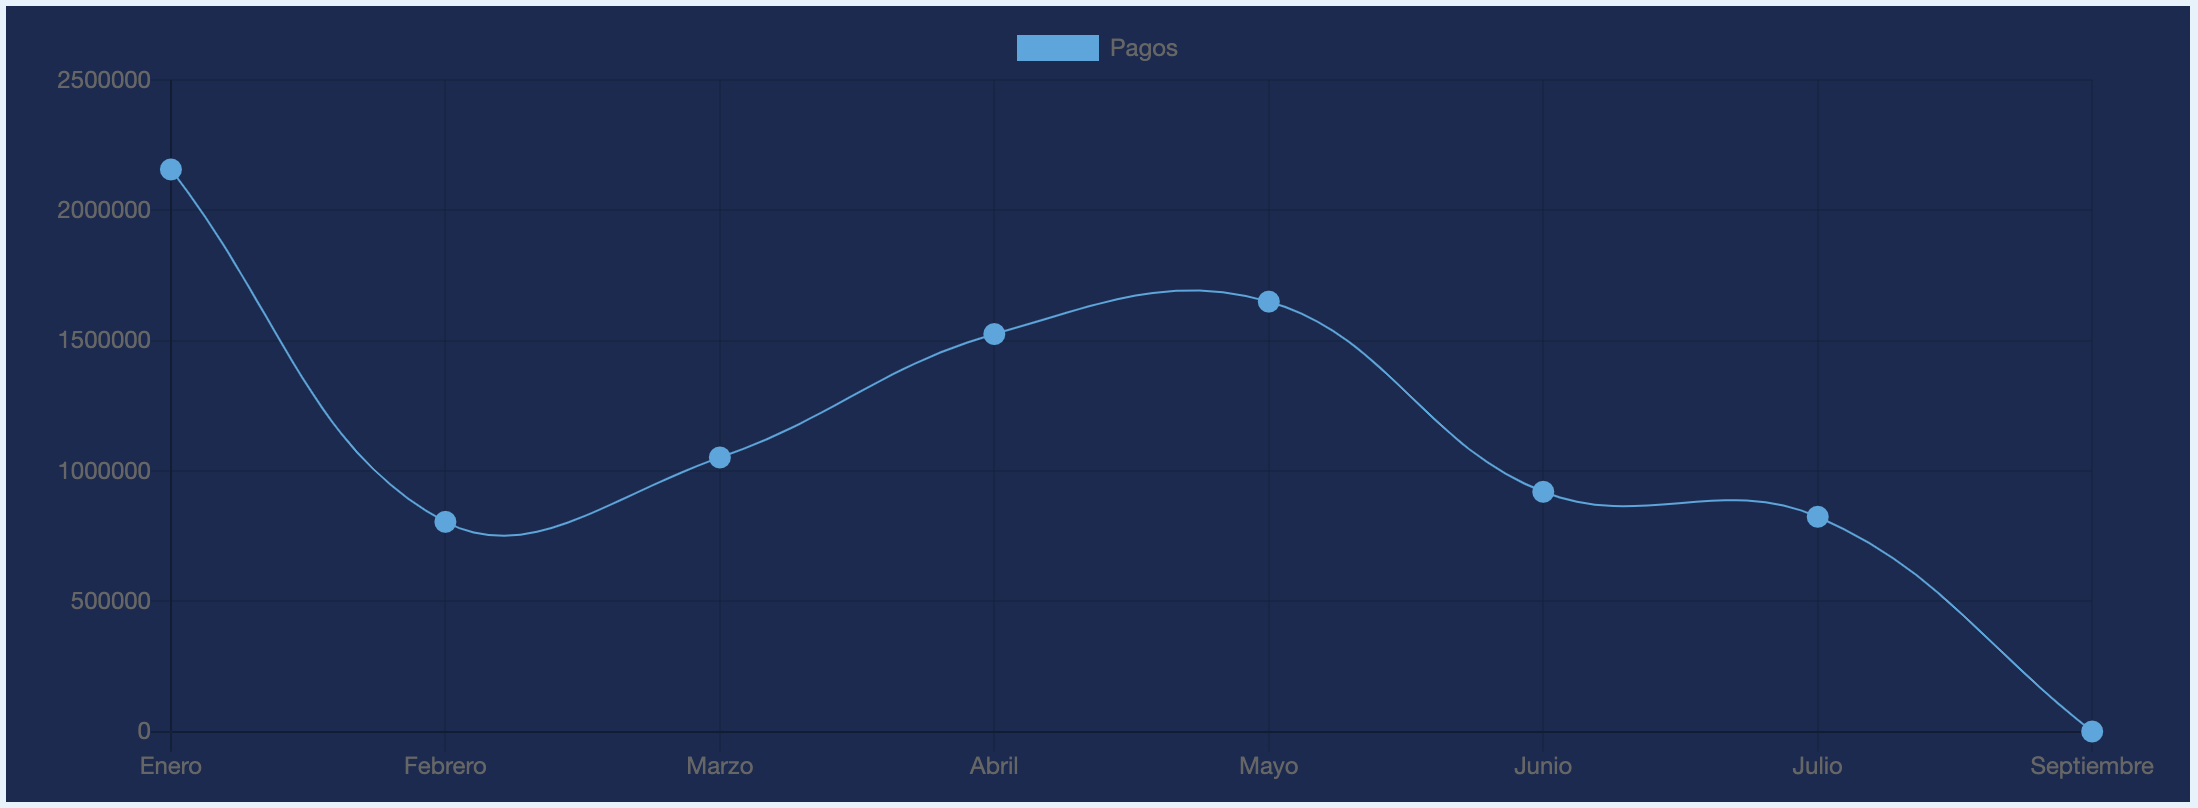
And that would be it, you can change the type of chart simply by changing the name in the variable “type” and the shape of the curve adding for example:
stroke: {
   curve: 'smooth',
},