How to create a Choropleth map

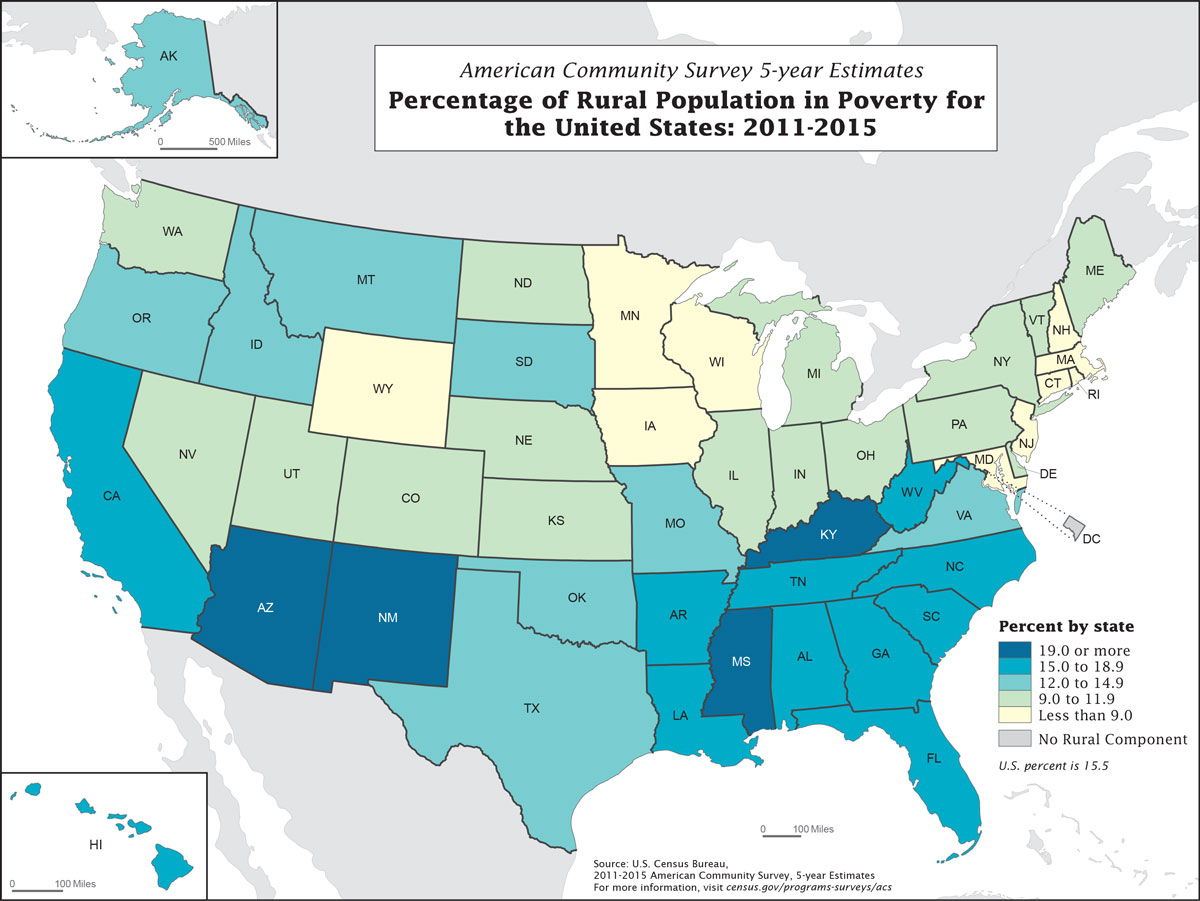
Good day to everyone here. I interested in creating a Choropleth Map ( A map that displays divided geographical areas or regions that are coloured in relation to a numeric variable.) in Wappler.

A typical example is elections results for 3 candidates. I’d like each region of the map to show a specific color based on which candidate won in that region.

Is this something I can use Wappler’s chart features to do? If no, which other approach can I use to achieve this within wappler.

@brad @teo @psweb @George @ben

Is this something you do a quide guide to? Can you kindly guide me through this? Example iss the map below. (I’m not going to use the US map. Lll)

That’s certainly a special case and can’t be done with Wappler alone. I don’t know if Google maos has such features or not.

Wappler doesn’t have such a feature. You should checkout the D3.js library.

Thanks @patrick and @brad for the responses. I am a bit surprised that this cannot be achieved in wappler entirely.

@Teodor and @George I this should be considered in the future updates of wappler. It should be possible to do this at some point in wappler entirely.

Well nobody has asked for it before. You can post a feature request and when there are more votes we will implement it.