I have 6 line charts on a page and would like to compare them at a glance
The issue I have is the data is all scored out of 10 but the y axis on the chart only goes up to the highest figure in the dataset which is not always 10.
Ideally I would like to fix all the charts so that the y axis ends at 10
Wappler has it’s own integration of chart.js. As far as I understand what is available in the Wappler UI is what is available a parameters/properties you can change. The Wappler “version” thus has it’s limitations, but it makes the basics easy to use.
For more options you will have to do your own charts.js integration and not use the Wappler one. It comes with lots of challenges and pitfalls if you are not a seasoned coder. Browsing the forum and searching posts on dmx.parse will help you with getting the data formatted for use. This Wappler does automatically for it’s version of charts.js.
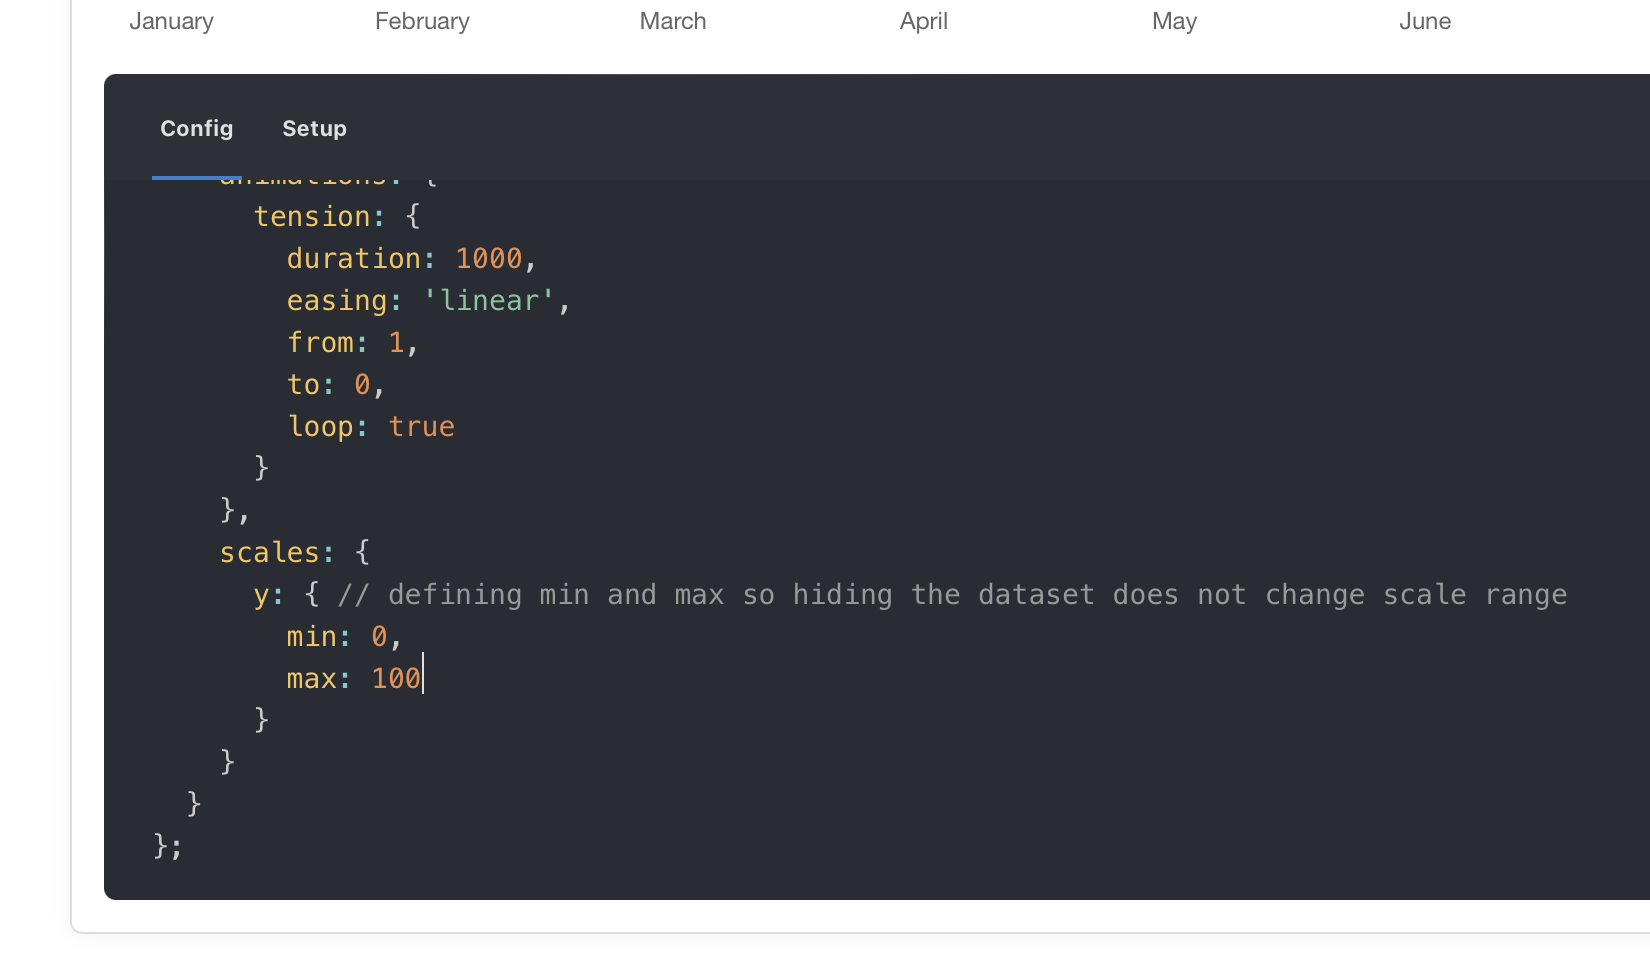
Chart.js documentation shows it is possible to set min and max of an axis: