Help getting SC query as an array to use in 3rd party JS Charts library

Hi All,

Looking for a bit of help or point in the right direction as i’m trying to implement/integrate a different JS chart library called apexcharts. I’m doing this at has features that are missing from the existing implementation of charts/charts.js in Wappler.

Right now i’m just asking for some help in parsing some data from a server connect query into the custom JS file for the chart to render.

It seems to accept data in a few ways but all are either a plain array, or an array of objects?

I’ve tried using dmx.parse('serverconnect1.load({}) but that just seems to show ‘undefined’ when i alert the result.

What would be the best/easiest way of getting the server connect query data ‘into’ the JS file in an acceptable result?

For the record, i have been able to get it to render using the results of the query, if i pasted them manually into the JS file. Its just how to make it more dynamic.

1 Like

I have recently tried Apex Charts too. I love the support for Sparklines for use in dashboard applications.

To use the data, call the Server Connect (untick ‘noload’ or use an dynamic event such as button click to call the serverconnect1.load({}) - you should be able to do this from the picker in the UI.

Once the data is loaded you can refer to it in several ways. In an external JS function (which it seems like you’re using), use dmx.parse('serverconnect1.data.indexname') to retrieve it. Just remember that the SC call needs to complete BEFORE the JS data retrieveal so maybe add a dynamic event to the SC call for success to run the JS function for the chart.

1 Like

Ben is right.

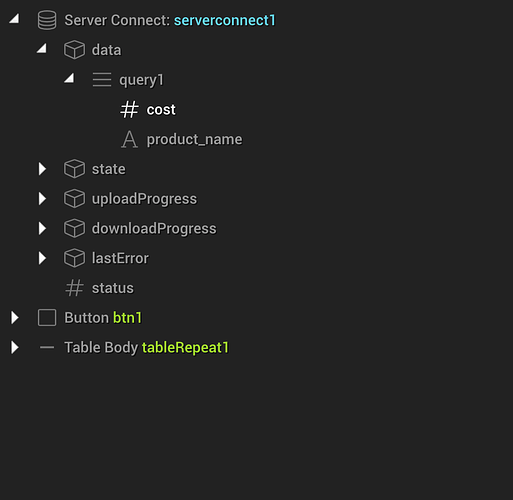
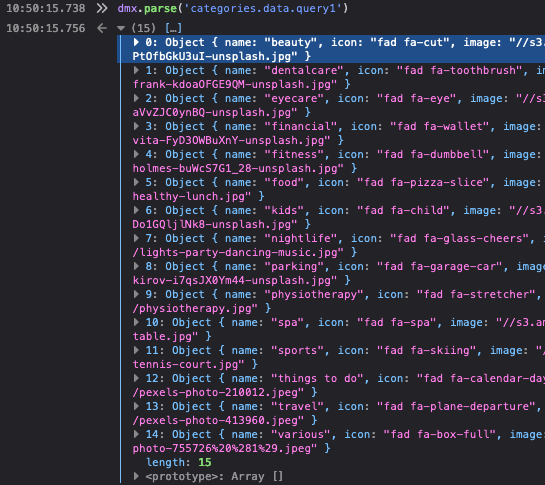
Here you got an example of what you should parse and load into the charts.

image

1 Like

Thanks @bpj and @JonL.

I had mostly covered off all of this, but something obviously wasn’t working. I’ve got it sorted now using this:

dmx.parse('serverconnect1.data.query1')

And running the function itself from App Connect through the ‘on success’ dynamic event of the server connect file. Previously i was using a ‘window onload’ which probably wasn’t helping.

Glad to hear you had good success with it @bpj it does look like a nice little chart library so i’m hoping i can get all the elements to work.

Would there be a better/more efficient performance wise way of loading in the data? i.e. direct from sever connect, rather than loading the server connect file in app connect and then parsing the data?

1 Like

You could fiddle with this:

You render an empty chart and once the server sends you the data it will load dynamically.

2 Likes

Hi @Philip_J, sorry to bother you but I have tried a thousand ways to make apexchart work dynamically and I have not been able to do it so far. Seeing that you have solved it, I wonder if you could give me a hand. I have a chart working on a blank test page, it works perfectly, but when I try to pass the dynamic values to it with dmx.parse it doesn’t take this data.
This is my code

	<script>
		var options = {
  chart: {
    type: 'line'
  },
  series: [{
    name: 'sales',
    data: [dmx.parse('serverconnect1.data.query1[0].cost')]
  }],
  xaxis: {
    categories: [dmx.parse('serverconnect1.data.query1[0].product_name')]
  }
}

var chart = new ApexCharts(document.querySelector("#chart"), options);

chart.render();
	</script>

I have my server.connect correctly configured and it returns 2 columns from my database: product_name and cost
If you are very busy, could you just copy and paste your script code, so that I can compare them and find my error?

Btw Im working with php
Thanks in advance

Hey @Max_Saravia,

Happy to help where I can. I did get it working but have since moved to Syncfusion only because they hard a particular feature I wanted. ApexCharts was good though and even a bit easier to get going.

From memory though the issues all came down to a timing issue, in that at the time when the apex script was running, the DOM wasn’t fully loaded and the server connect file wasn’t loaded to be able to parse the data through.

You could wrap everything you have in that script in a function, and then call that function on a successful loading of your server connect file. That’s the easier way, so might be good to test that. Its not ideal though because then any variables or methods used inside the function can’t be called outside of the function, so trying to update the data means calling the whole function again which loads all elements of the chart instead of just rendering it etc.

I think what I did that was better, but I can’t recall the exact syntax for ApexCharts, was to have it like you have now so that chart loads empty on page load, and then the successful loading of the server connect file (or any update to it) it refreshes the chart data and re-renders the chart.

I think this is the same as adding new data and calling chart.render()

Sorry I can’t be more help, it’s just I moved to another library…but it does work :slightly_smiling_face:

1 Like

Ok, so found some old code… I think this was working…but not sure. It is the same theory i spoke about above:

The main point was that all the main parts of the code were NOT in a function, so I could use the var names.

The chart was rendered with no data and showing the text Loading...

Then I had a function I could call on successfully server connect load (using Wappler Flows) that update the data using chart.updatesSeries() which I believe updates the data and renders the chart

var options = {
    chart: {
        type: "bar",
        fontFamily: 'Open sans',
        animations: {
            enabled: true,
            easing: 'easeinout',
            speed: 300,
            animateGradually: {
                enabled: true,
                speed: 100
            },
            dynamicAnimation: {
                enabled: false,
                speed: 300
            }
        }
    },

    stroke: {
        show: true,
        curve: 'smooth',
        width: 3
    },
    dataLabels: {
        enabled: false
    },
    series: [{
        name: 'Calls',
        data: []
    }],
    xaxis: {
        type: 'datetime',
        labels: {
            datetimeFormatter: {
                year: 'yyyy',
                month: 'MMM \'yy',
                day: 'd MMM',
                hour: 'HH:mm'
            }
        }
    },
    yaxis: {
        forceNiceScale: true,
        min: 0,
        showForNullSeries: false
    },
    noData: {
        text: 'Loading...'
    },

};

var chart = new ApexCharts(document.querySelector("#chart"), options);

chart.render();

function chartUpdate() {
    chart.updateSeries(
        [{
            name: 'Calls',
            data: dmx.parse('serverconnect1.data.query1')
        }]
    )
};
1 Like

Hi @Philip_J , thank you so much for your quick response and for taking the time to try to help me, I really appreciate it very much.
I followed your advice and as a test I put a button so that when I press it it loads the function that the script contains.
My problem … and I know it must be something very silly, but my knowledge so far of javascript is limited, it is that it only returns a result in the graph.

Grabación de pantalla 2020-10-09 a la(s) 14.58.30

So I thought, I have to make it repeat for each record of my query so that it shows all the values, I tried it by hand by duplicating the dmx-parse and changing the value of record [0] to 1,2,3

<script>
		function graph() {
var options = {
  chart: {
    type: 'line'
  },
  series: [{
    name: 'sales',
    data: [dmx.parse('serverconnect1.data.query1.data[0].cost'), dmx.parse('serverconnect1.data.query1.data[1].cost'),dmx.parse('serverconnect1.data.query1.data[2].cost'),dmx.parse('serverconnect1.data.query1.data[3].cost')]
  }],
  xaxis: {
	  
    categories: [dmx.parse('serverconnect1.data.query1.data[0].product_name'), dmx.parse('serverconnect1.data.query1.data[1].product_name'), dmx.parse('serverconnect1.data.query1.data[2].product_name'), dmx.parse('serverconnect1.data.query1.data[3].product_name')]
  }
}

var chart = new ApexCharts(document.querySelector("#chart"), options);

chart.render();
}

	</script>

Grabación de pantalla 2020-10-09 a la(s) 14.57.34

The problem, of course, is that I know it is not done this way since the idea is that it takes all the values ​​of the query and repeats them automatically.

I’ve been trying to solve this problem all morning, because I don’t want to waste your time, but so far I haven’t been able to come up with the answer.
I’ve tried typing:

data: [dmx.parse('serverconnect1.data.query1.data['0', '1', '2'].cost')]

data: [dmx.parse('serverconnect1.data.query1.data.cost')]

data: [dmx.parse('serverconnect1.data.query1.data['0'- '8'].cost')]

data: [dmx.parse('serverconnect1.data.query1)']

Without success.
If i do what u did in your example:

data: [dmx.parse('serverconnect1.data.query1']

I got this in return:

So I’ve been studying how to work with arrays in vanilla javascript

here https://www.w3schools.com/js/js_array_methods.asp

But I still can’t solve it, it’s incredible when you solve bigger problems easily and small problems leave me thinking for hours hahahha.
I would appreciate any help you can give me.

This is my code now:

<script>
		function graph() {
var options = {
  chart: {
    type: 'line'
  },
  series: [{
    name: 'sales',
    data: [dmx.parse('serverconnect1.data.query1.data[0].cost')]
  }],
  xaxis: {
	  
    categories: [dmx.parse('serverconnect1.data.query1.data[0].product_name')]
  }
}

var chart = new ApexCharts(document.querySelector("#chart"), options);

chart.render();
}

	</script>

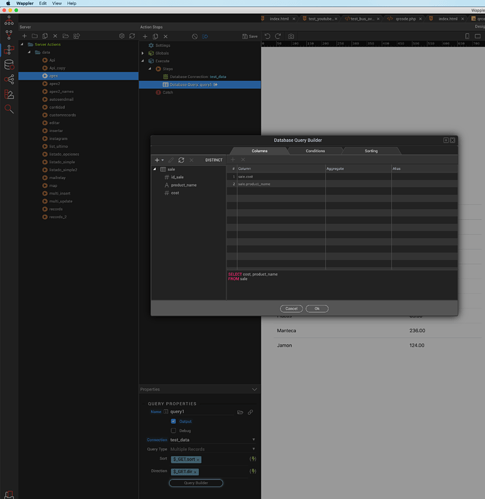
And this is my query:

Thank you

Hey max,

Just a few things that come to mind.

  1. I’m not sure why you’re working with repeats and trying to use dmx parse multiple times etc. I would have thought you would have one query that has the all data you want to display?

  2. In the Series name, I think that needs to match verbatim the field you want to plot in your query. So you would parse the query like I had in my example, but instead of sales, you need to use the field name you want to grab the data from i.e. ‘cost’ instead of sales.

You might also need to look at the query being a paginated query as it will limit your results unless that’s what you want.

So if it was me, I’d try

series: [{
    name: 'cost',
    data: [dmx.parse('serverconnect1.data.query1.data')]
  }],

If that doesn’t work, try changing the query to multiple records and adjust the name accordingly.

I’m only a beginner in JS as well :slightly_smiling_face:

1 Like

Hi @Philip_J, yes, at one point i changed from multiplerecords to paged because I was trying different ways to make it work and I put a limit of 9. Now I put it back in multiple_records.
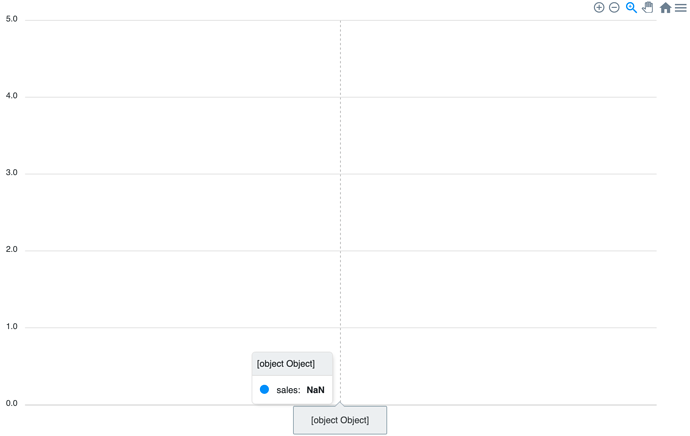
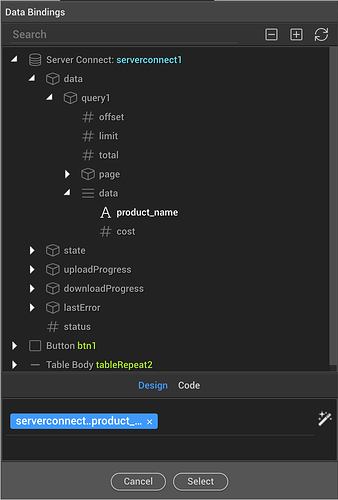
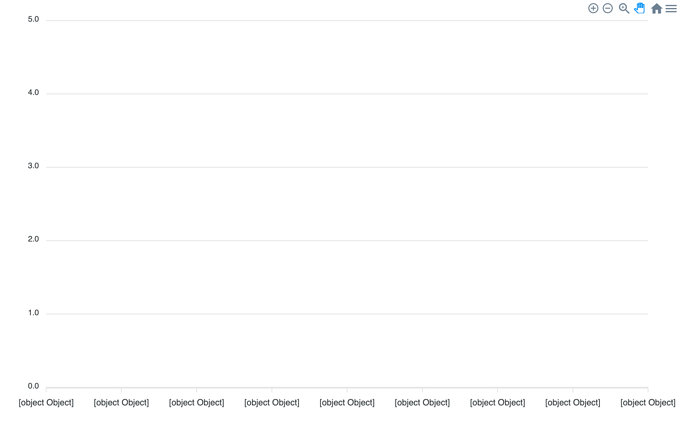
The thing is that either it shows me only a record if I put in like this: serverconnect1.data.query1 [0] .cost and serverconnect.data.query1[0].product_name in the graph or if I leave it as serverconnect1.data.query1 it shows me the result as objects:

I also tried, as you said, putting the field name as name: ‘cost’, but it didn’t change at all. It’s driving me crazy! hahha
But again thank you very much @Philip_J for all the time you took to help me.

Maybe @patrick or @Teodor can help me to see what I’m doing wrong or at least show me a way so I can figure it out before I lose my mind :woozy_face: :crazy_face:

So, to clarify what im trying to achieve:
I am trying to display two fields from a database within apexcharts using the dmx.parse method, the field names are: cost (decimal) and product_name (varchar)
Follow the documentation steps and recreate the first example: https://apexcharts.com/docs/creating-first-javascript-chart/
It worked perfectly. Now when I try to make it dynamic using the data from my serverconnect1.data.query1 it doesn’t work for me as it doesn’t pass the data correctly to the fields like it should.

this is my code now:

	<script>
		function graph() {
var options = {
  chart: {
    type: 'line'
  },
  series: [{
    name: 'cost',
    data: [dmx.parse('serverconnect1.data.query1[0].cost')]
  }],
  xaxis: {
	  name: 'product_name',
    categories: [dmx.parse('serverconnect1.data.query1[0].product_name')]
  }
}

var chart = new ApexCharts(document.querySelector("#chart"), options);

chart.render();
}

	</script>

If i do this:

data: [dmx.parse('serverconnect1.data.query1[0].cost'), dmx.parse('serverconnect1.data.query1[1].cost'), dmx.parse('serverconnect1.data.query1[2].cost')]


categories: [dmx.parse('serverconnect1.data.query1[0].product_name'), dmx.parse('serverconnect1.data.query1[1].product_name'), dmx.parse('serverconnect1.data.query1[2].product_name')]

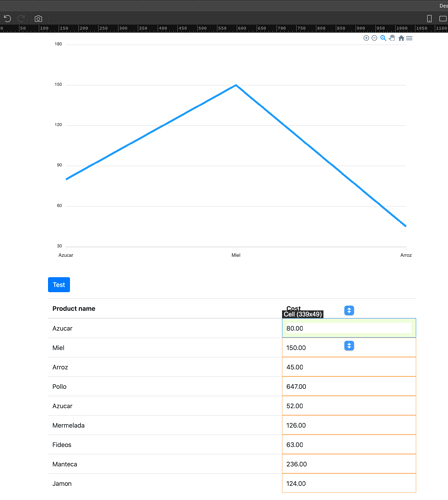
It shows me the graph correctly as you can see here:

I have a button that when I press it calls the function graph () (after the information from the query is loaded).

I will appreciate any help

Thnks in advance.

I can give a suggestion on extracting lists of of data tables, but I am not sure if that would solely help.
I have not used any charting tools yet in a Wappler project.
So, from the discussion/code above, what I understand is that you need to pass an array of data, for a particular axis.
What I see in the shared code snippets is either trying to provide 0th index item, or the entire object.
Here is how you can just get the list of a particular property:

EG: Assuming the server connect contains data array with properties like ‘sales’, ‘count’, ‘date’ etc.
To just get the sales list, you can try this:
dmx.parse("sc1.data.query1.groupBy('sales').keys()")

What this does: It groups the complete data set by unique ‘sales’ values. Now each ‘sales’ element becomes the “key” in the resulting JSON, with complete row structure as its “value”.
Applying the keys() method, you can get the list of just the sales values, because that was used to group the data.

NOTE: just a suggestion based on what I see here. Haven’t used charting stuff in Wappler - natively or otherwise.

1 Like

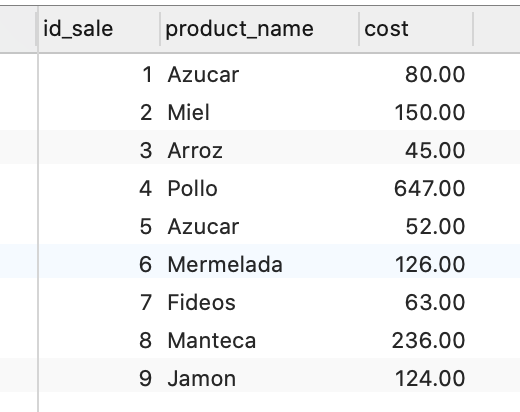
Hi @sid, thnks a lot for your help!, yes i have a test table (sale) with only 3 fields: id_sale, cost, and product_name.

The query its very basic as u can see here:

Captura de Pantalla 2020-10-10 a la(s) 13.16.46

All i want to show is an apexchart with the values of: product_name
(x-axis) and cost (y-axis)

I tried your idea:

	<script>
		function graph() {
var options = {
  chart: {
    type: 'line'
  },
  series: [{
    name: 'cost',
    data: [dmx.parse("serverconnect1.data.query1.groupBy('cost').keys()")]
  }],
  xaxis: {
	  name: 'product_name',
    categories: [dmx.parse("serverconnect1.data.query1.groupBy('product_name').keys()")]
  }
}

var chart = new ApexCharts(document.querySelector("#chart"), options);

chart.render();
}

	</script>

The chart shows blank. But thnks for try to help me, i really apreciated.

Can you share a link to the documentation for this library where it uses this data thing?

Hi @sid, of course, this is the link: https://apexcharts.com/docs/installation/

Not link I was asking for, but managed to search for correct doc.

Get rid of square brackets. The data you are passing is already an array.
Try this:
data: dmx.parse("serverconnect1.data.query1.groupBy('cost').keys()")

1 Like

Ok @Max_Saravia Thought id load up my old test file and recreate for you, as it wasn’t this hard by memory :slight_smile:

So after playing around a bit, i found the easiest way, without needing to use keys or groupBy was to change your query to match what Apexcharts calls a Paired Value:

From their website:

series: [{
    data: [{
        x: 'Apple',
        y: 54
    }, {
        x: 'Orange',
        y: 66
    }],
}],
xaxis: {
  type: 'category'
}

So in this example, it is expecting you to parse in the X and Y values in the same query, in our case using dmxparse(serverconnect1.data.query1)

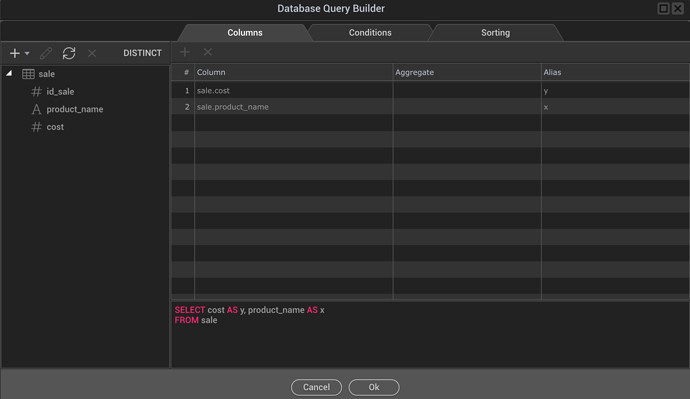
This is as easy as using the alias x and y when you create your query, like this:

Then, in the chart.js where you have your charts code, you simple use dmx.parse('serverconnect1.data.query1')

This is my code in my chart.js file:

var options = {
    chart: {
        type: "bar",
        fontFamily: 'Open sans',
        animations: {
            enabled: true,
            easing: 'easeinout',
            speed: 300,
            animateGradually: {
                enabled: true,
                speed: 100
            },
            dynamicAnimation: {
                enabled: false,
                speed: 300
            } }
    },
    stroke: {
        show: true,
        curve: 'smooth',
        width: 3
    },
    dataLabels: {
        enabled: false
    },
    series: [{
        name: 'calls',
        data: []
    }],
    xaxis: {
        type: 'datetime',
        labels: {
            datetimeFormatter: {
                year: 'yyyy',
                month: 'MMM \'yy',
                day: 'd MMM',
                hour: 'HH:mm'
            }
        }
    },
    yaxis: {
        forceNiceScale: true,
        min: 0,
        showForNullSeries: false
    },
    noData: {
        text: 'Loading...'
    },
};
var chart = new ApexCharts(document.querySelector("#chart"), options);

chart.render();

function chartUpdate() {
    chart.updateSeries(
        [{
            name: 'calls',
            data: dmx.parse('serverconnect1.data.query1')
        }]
    )
};

And then on my page, i call the function i created called chartUpdate when the server connect file loads/success

<dmx-serverconnect id="serverconnect1" url="api/testing/chart" dmx-on:success="run({runJS:{function:'chartUpdate'}})">
</dmx-serverconnect>

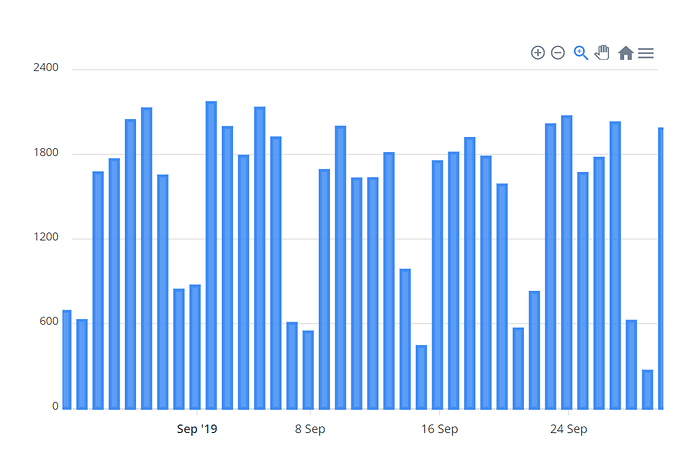
That’s it. Nothing else special in the query or in dmxparse. Plain query with dates on one axis and then values on the y axis.

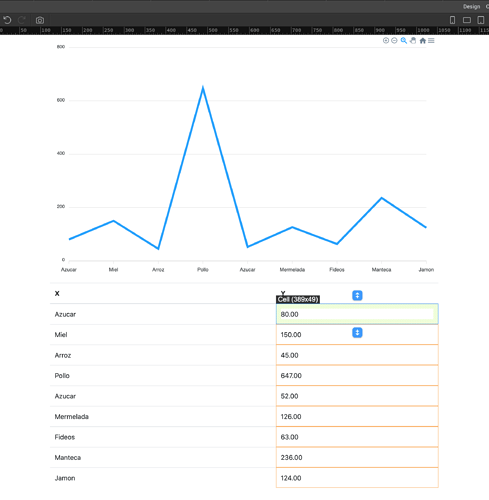
end result:

Hope this helps!
3 Likes

Hi @Philip_J , thank you so much !! You are a genius! I had already tried putting x: serverconnect1.data.query1.costo and y: serverconnect1.data.query1.product_name, but it had not occurred to me to use aliases in the server connect query.

So for anyone who needs to do the same, I’m going to paste the code from my test:

	<script>
		var options = {
  chart: {
      height: 350,
      type: 'line',
  },
  dataLabels: {
      enabled: false
  },
  series: [],
  title: {
      text: 'Apex Chart Test',
  },
  noData: {
    text: 'Loading...'
  }
}

var chart = new ApexCharts(
  document.querySelector("#chart"),
  options
);

chart.render();

function chartUpdate() {
    chart.updateSeries(
        [{
            name: 'Cost',
            data: dmx.parse('serverconnect1.data.query1')
        }]
    )
};

	</script>

And as u suggested i used onsuccess action to call the script:

<dmx-serverconnect id="serverconnect1" url="dmxConnect/api/data/apex.php" onsuccess="chartUpdate()"></dmx-serverconnect>

Well @Philip_J, I want you to know that when you come to Buenos Aires, Argentina I will invite you a good traditional meal and the best wine from this land :smiley:.

Thanks to you too @Sid, for trying to help me and I extend the same invitation to you :smile:.

Cheers

3 Likes

This is really useful everyone, would be great to see the free ApexChart library within the Wappler UI.

4 Likes

No worries Max. I understand what it’s like and I’m happy to give back to the community when I can :slightly_smiling_face:

2 Likes