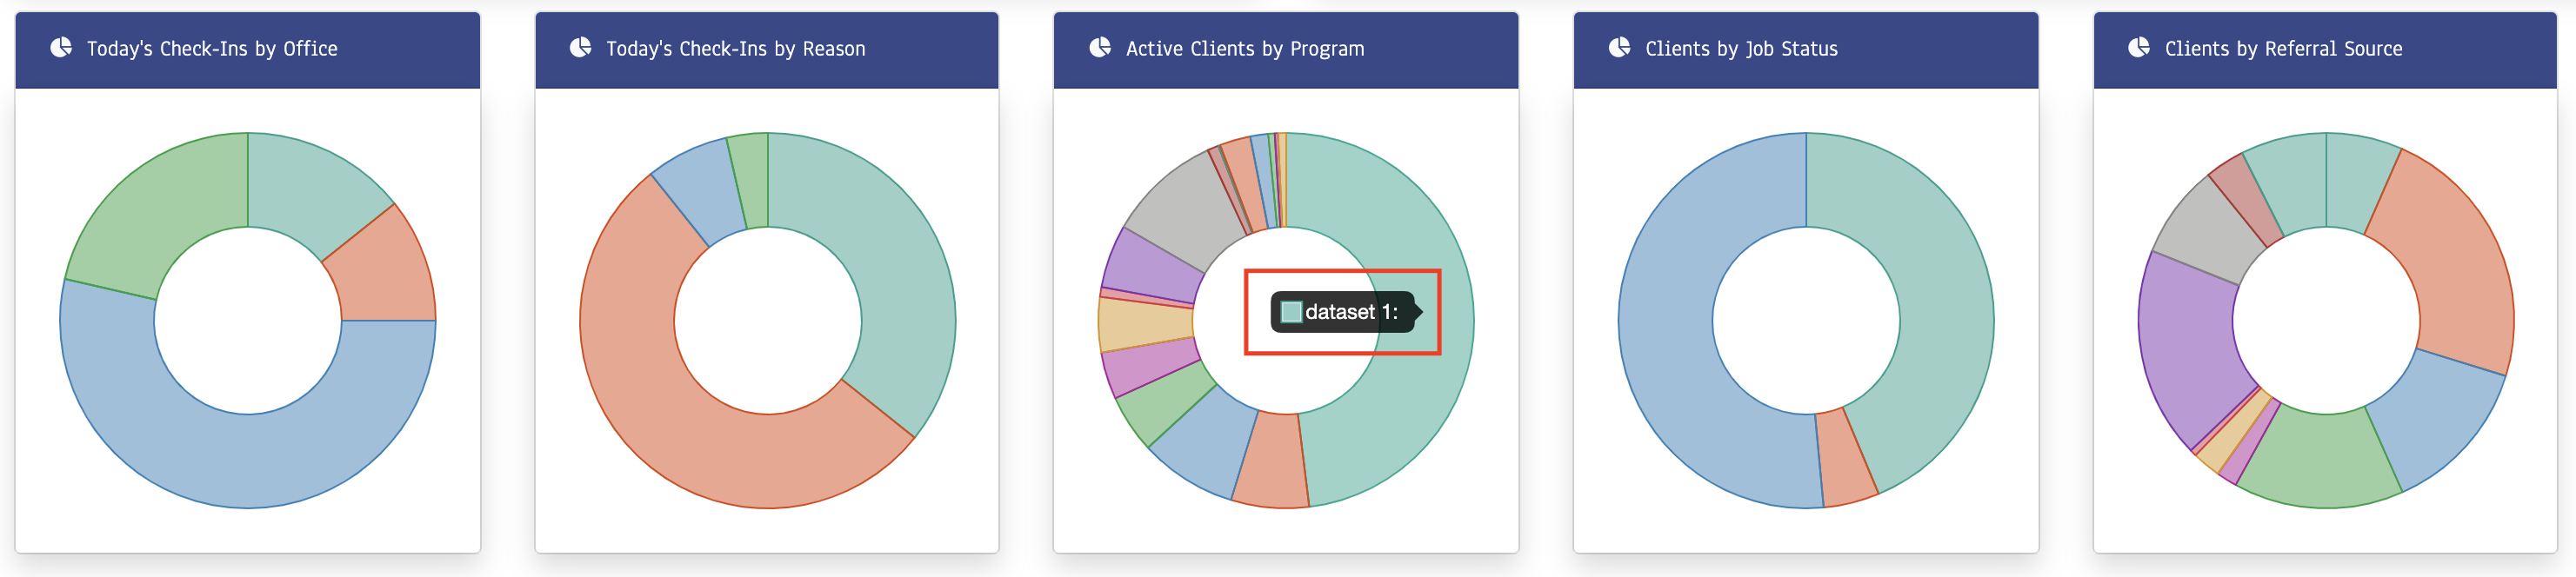
I have had these charts on my dashboard for a couple years at least and they were always working fine. Now recently, although it appears to be working visually, when you hover over any of the values. the tooltip just says ‘dataset 1’. It’s like this on all charts on this page.
Updated chart component to support custom tooltip text
May well not be backward supporting, ie you might need to update the tooltip text? Which could be a pain in the arse as we have so many Project pages with charts, am going to go through now and check them all as a result of your post…
Hmm appears the first Project I checked has its tooltips… Will go through the rest tomorrow. Between then and now am sure you’ll get an answer from one of the team. Were the tooltips formatted, ie had formatters applied, at all? I believe this was part of the reason for the update, as to display currency correctly was the main focus, don’t quote me on that though.
We may well be in the same boat Brad. We have dashboards full of them in some circumstances. I've just sat down after a crazy day so don't want to dive too deep right now. Although the OCD side of me says check them all right now hahaha...
Here an update, there were some chart types like the pie and doughnut that didn’t show the correct labels. Also updated the chartjs to 2.9.4 which was the latest release of v2. Will do some testing with v3 to see if it has many breaking changes.