Wappler Version : 3.5.7
Operating System : Windows 10
Server Model: NodeJS
Database Type: PostgreSQL 11.1.x
Hosting Type: Docker
Expected behavior
Once DB connection is established, it should remain as long as docker container is open and operating.
Actual behavior
What actually happens?
This change has only just started happening with this current version of Wappler (or maybe the previous as well)
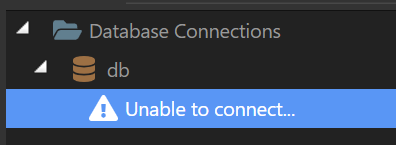
The application works normally as expected with the DB connection working fine. Then suddenly the connection breaks and no data is available. If i go to the DB manager (or check manually in Navicat) I see this error:
I am not doing anything in particular in the app, and it happens if I am in Wappler or if I'm using Chrome localhost.
I have not changed anything in the application in the last few weeks that would impact this.
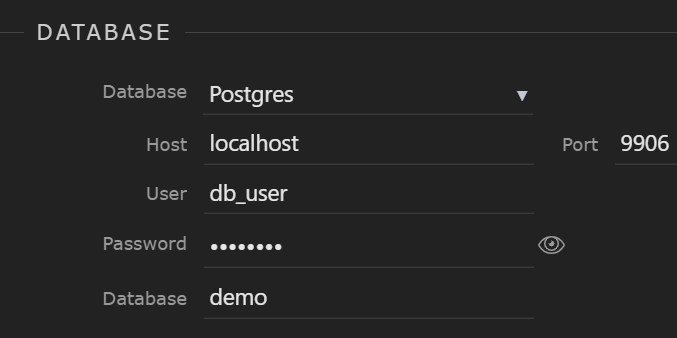
My DB connection settings are stock-standard for this target:
To fix the issue i need to either re-deploy the target, or restart services. But it then happens again, sometimes only 5 minutes later.
How to reproduce
Details above.
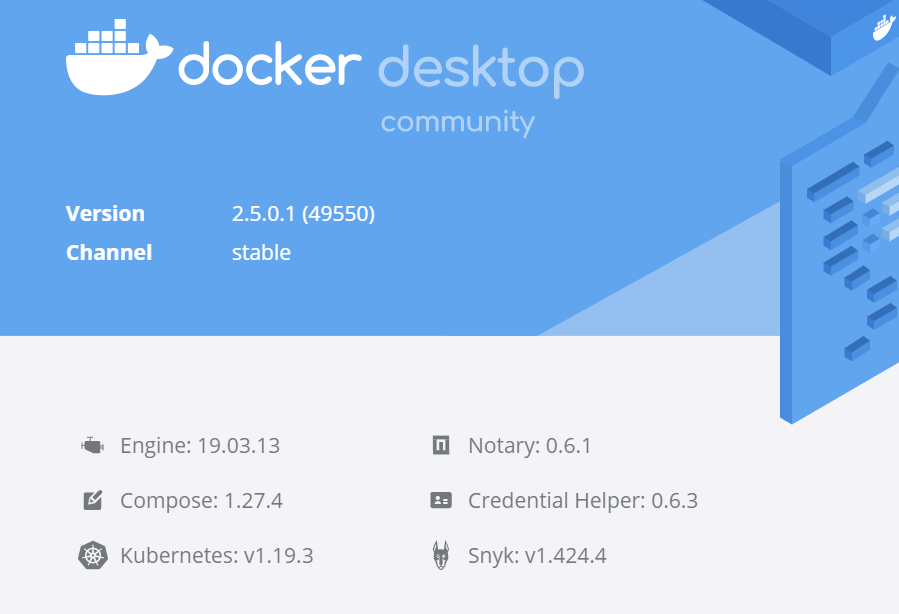
EDIT: I did actually upgrade Docker Desktop recently...which i hadn't done in some time. I don't know what version i WAS on, but this is what my current version is:
Checked, and it still doesn’t work opening a server connect action directly in browser. Here is the error message:
{"status":"500","code":"53300","message":"sorry, too many clients already","stack":"error: sorry, too many clients already\n
at Parser.parseErrorMessage (/opt/node_app/node_modules/pg-protocol/dist/parser.js:278:15)\n    at Parser.handlePacket (/opt/node_app/node_modules/pg-protocol/dist/parser.js:126:29)\n
at Parser.parse (/opt/node_app/node_modules/pg-protocol/dist/parser.js:39:38)\n
at Socket.<anonymous> (/opt/node_app/node_modules/pg-protocol/dist/index.js:10:42)\n
at Socket.emit (events.js:315:20)\n    at addChunk (_stream_readable.js:295:12)\n
at readableAddChunk (_stream_readable.js:271:9)\n
at Socket.Readable.push (_stream_readable.js:212:10)\n
 at TCP.onStreamRead (internal/stream_base_commons.js:186:23)"}
Also, it probably only takes 2-3 minute from restarting for it to error out.
Hey @Philip_J this happened to me on Postgres. As standard I believe (from memory) it only has a 10 connection limit, I think the issue in Wappler came down to connections not terminating and each connection counting for 2 in Postgres. This is all from memory but the way to solve it is to setup connection pooling
Yeah I’ve got a top level rough understanding of connection pooling and know I’ll need to look into eventually…the problem here is that nothing has really changed in my workflow at the moment and it’s been working most of the year…untill a few days ago
Something is definitively using a lot of connection, or not releasing its connection after usage. The question is what is causing it, is it the database manager in Wappler or perhaps Server Connect. The default max_connections in postgres is 100, so that should normally not reached that fast.
So i just used the Sever Monitoring tools in Navicat (they are supposed to be premium) but will look at PGADMIN if need be.
From what I can tell, and excuse me if I use the wrong terms, the DB does not seem to be ‘releasing’ any of the connections every time a query to the DB server is executed.
So after i restart the docker server, in the server monitoring it has db_numbackends at 0
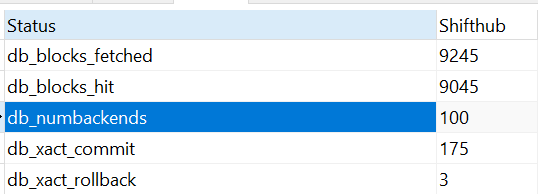
Then, with every page refresh, or doing something that sends a query to the DB, this number keeps going up. Once it hits 100, the DB crashes and i get the above error.
Here is a snapshot of the status from Navicat:
There is naturally more detail in the tool, including all the individual processes run.
From some brief analysis, it appears that every single process run (either a SELECT or UPDATE query basically) it has counted as 1 connection. There seems to be exactly 100 processes that were run by me on the front end refreshing the page or making some other DB queries.
I’m no expert, but this doesn’t seem right?
Also, like i said, only changes recently have been upgrading Docker and upgrading Wappler.
I think the problem is when you work with Wappler you are editing files from your server and each file change triggers a server restart. I believe that when the server is restarted the previous database connections are not being released correctly because of the hard restart and that causes connections to stay active until they finally timeout. On normal usage without the server being restarted each time it should not happen, you probably only see this problem when working with Wappler. I will see if I can do some cleanup when the server is being stopped.
Just to clarify, I only did a hard restart on the server a couple of times. Most of the time I was just re-deploying the target once it hit its limit so I could continue to develop and test my application.
Also, most of the testing of this problem I did yesterday ( I probably got this error 30-50 times) I wasn’t saving Wappler at all. I was simply using the app in Chrome on local host.
Matt could be right here... What was not sitting right with this comment though was that this is the first time it's happened in almost a year of development.
BUT it is is POSSIBLE that all other times I've been testing and developing I have also been making changes to server connect files and thus restarting the server like @patrick said. I'd often save a file, test things out, rinse and repeat.
This week I've just been testing things and grabbing screenshots for sales/marketing...haven't saved anything in Wappler at all. Perhaps the problem has been there all along???
@patrick I’ve actually now started getting this on my staging environment. Docker with Docker MySql 8 DB. Something is definately not right as MySql has a lot higher connection limit by default as I understand it, plus it’s literally just myself and my co-founder doing QA and testing. I’d say the connections are staying live?
I created a new project using same settings (Docker, Postgres, Node etc). Used the sample database and created a number of queryies. It all worked perfectly. Only 1 connection was maintained despite how many queries i ran.
The reason this happened was because in this test project i ONLY used the new GLOBAL DB connection.
In my normal project, i have a DB connection in every API file as that’s how it was built.
If i remove the DB connection step, and use the global DB connection, then running that query does not create any additional DB connections.