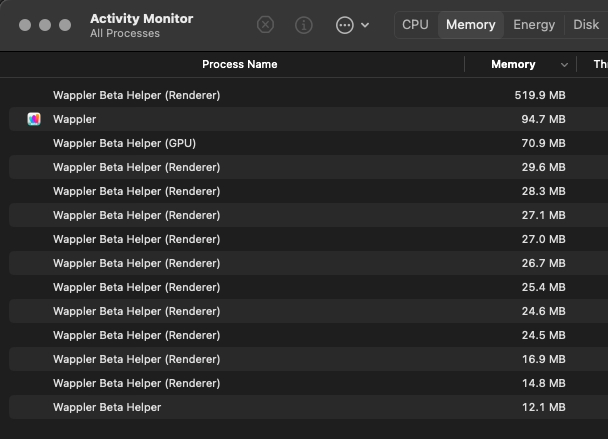
Finding that opening several pages one after the other is causing some crazy memory usage in 7B/12. The pages are efficient and contain no errors, they don't even have dynamic data in them yet (have also tried more than one Project and the same result). Have restarted (laptop and Wappler) and did the same again and memory continues to spiral towards the stars.
I'll update to 7B/14 now and check again and see if there is an improvement.
Not much better at all. Something to try...
- Start Wappler and look at the initial memory usage, not too bad.
- Open a few pages, pages with something in them not just blank.
- Memory goes up, obviously now there are a few pages being rendered.
- Now close the pages and leave one open.
- Check your memory again, not so good.
Memory usage should decrease as now only a single page open and being rendered but this is not the case. The memory usage still remains high.
On my MacBook with about 10 pages open it barely goes over 400MB. What operating system are you using?
Ubuntu 24.04.1 LTS
In the eyes of Teodor this is a real mans OS...
![]()
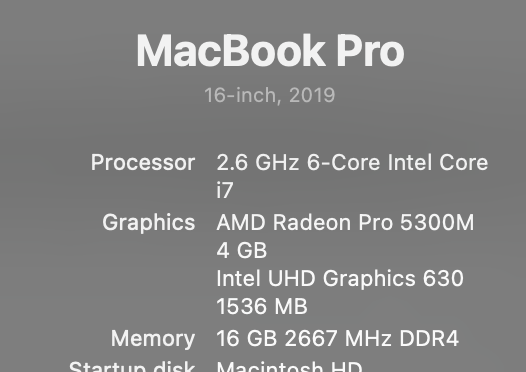
Outside of Wappler it is incredibly efficient and barely scrapes the surface of my resources. This has only been occurring for a short while though, maybe over the last couple of Beta versions. I only have 12gb of memory so can't afford to waste any. Although a new laptop is on the cards in the new year at some point (hopefully in the first quarter) I'm stuck with this one for now (which has always been very dependable). This could very well be an Electron issue and not a Wappler issue though! Chrome is an utter stinking pig of a thing...
I posted about the significant increase in memory usage some time ago (v6.8). This is still happening in v7b14. (MacBook Pro, M2).
The main reason seems to be an instant refreshing of the design view when making any modifications in the code view. Over a short period of time, the constant refresh process begins to consume more and more memory, and the code view starts lagging and becomes slow to respond. The memory usage stays fairly stable while working with the APIs.
Well we do use chrome internally and each page is isolated so opens a new process with its memory usage and chrome is known to be not the most memory efficient browser.
What you can check is, if the memory is well released after the pages are closed.
And also on what type of pages it occurs - just web pages with design view or also on server connect editors?
Interesting post…
I’ve worked almost totally with server connects in the last few weeks, but needed to work on the front end yesterday and found Wappler became quite sluggish…
This seems to be the issue for us @George
In our case the pages are very simple in relative terms. Currently they have no Server Connect Actions within them. JS and CSS only, with Bootstrap and Moment from CDN sources. Really spikes when App Connect Mode is active. Still memory is not fully released when the pages are closed (just a little drop in memory is noticeable, a hundred or so MB).
We updated to the latest Beta last-night and are still experiencing pretty much the same although not quite up to the 1.6gb shown above it is still around the 900mb - 1.4gb (fluctuating) level with just a few pages open.
My laptop is not the greatest but it is reliable.
- Ubuntu 24.04.1 LTS.
- Intel® Core™ i7-4710HQ × 8.
- 12,0 GiB Memory.
- 960,2 GB SSD.
Still have to say the new Beta is the absolute dogs bollox! A Brits way of saying its really really nice, and loving what you guys have done. Amazing work gentleman!
Hmm could you trace it back to previous betas or Wappler 6.8 when it was ok?
Strange, here is my set up and I have no noticeable memory/performance problems at all on my 5 year old MacBook?

And on a typical session I am running:
- Wappler 7.b14
- Chrome
- Navicat
- MAMP PRO
- Outlook
- Microsoft Teams
Here is my usage:

Think I've pinned it down @George
I noticed it when commenting some lines and every few characters the page refreshes, so if that comment was a sentence 'This is a comment so you remember what you did last weekend' the page refreshed half a dozen times during writing it. And on top every action within the page en tales a refresh. Thus if you work quite fast there are an awful amount of refreshes occurring. This seems to be the issue and this is when my fans ramp up considerably.

I have also noticed the same issue; the instant refreshing of the design view when working in the code editor significantly increases memory usage.
I'm not sure if it is the cause of all the slowness but it is something I have noticed (even in B16) - if editing using code view within nested areas that might hide/show such as accordion/collapse/offcanvas/modal everything slows to a crawl (I'm on a M4pro Mac Mini!) - I sometimes have to wait a couple of seconds for things to catch up after just typing one or two characters.
On the same page, I can type code freely, without the delay, on part of the page where no condition/collapse etc. is being applied
Perhaps the toll of the design view refreshing and re-rendering these sections is too much.
p.s. this still happens when using just code view (not just split view)
BUMP! Driving me crazy as every time you make a change CPU usage goes from a steady 0.05% or so right up to 20% plus! Then if you are quick to make edits it climbs even further. Open Resource Manager and make a change in a page and watch for yourself... This really needs to be resolved. I can see it is assigned months back but still no resolution. This AI obsession is really affecting Bug resolution times. That maybe very unpopular to say but its certainly taking valuable time away from issues that deserve a higher priority. Even more so with the past couple of updates which seem to be entirely AI focused with very few Bug fixes.
I would say try the latest beta with the new Electron 35 to see if there is any difference but on Linux unfortunately the new electron in Wappler didn’t make it yet. Only on Mac and windows but we are working on it
Evening George,
I'm running version 7.0.0 Beta 19 and if anything it is now worse with all the extra threads spawned and numerous empty Project windows that appear when I open Wappler despite only having a single Project open when I close Wappler. I close the extra windows down and exit the hanging threads and start Wappler again to have it open up at least three Project windows again (I quit from the menu bar properly). Then on a restart when I try to select my Project I get an error that tells me my Project is already open in a window when they are all blank with no Project selected.... And I re-start Wappler again then it decides to open the Project but still opens multiple instances once more. I'm sure there is already a Bug Report on this happening (multiple windows opening on start-up) but if not I shall create one?
Good to hear and thank you for the Linux love I really do appreciate it a great deal.
I was about to create one, but can't replicate steps, it's like a random thing, but yes, it's a thing

