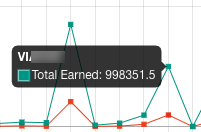
So is there some way to make it view in a graph with the currency formatter on so when i hover over the point it does not look like this.
But rather NOK998,351.50 as it just makes it easier to read with larger numbers like these.
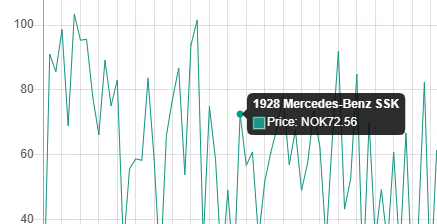
EDIT: I do see what you are saying though, if the tooltip displayed number is the same number as the graph uses to draw, then I can understand it has no way to graph NOK1,200.00 as it is no longer a number, just wondering if there is a way to only format the tooltip displayed number, and leave the actual data for the data point as it so it can still graph correctly.
I’m currently also working with the charts and tested it. It looks like formats can’t be applied to dataset-values. Means if I format 2000 to 2000.00 the chart isn’t showing any data any more.
You could maybe pass the formatted number as another field from the server action and place it in the labels, but the raw number still shows in the value part of the tooltip.
Thank you so much, you made my day, so happy, works perfectly.
EDIT: Just to double check @Teodor even though this is working perfectly as I have it, was I meant to delete any of the existing stuff or just add the new like below.
 Just add the