This has happened at least 4 times today. I haven’t been doing anything too complex. Just code editing and saving files. Then at certain points Wappler freezes. I’m unable to cancel using the window’s X. I’m unable to use the “restart Wappler” menu item. The only way I’m able to kill it is through Windows Task Manager.
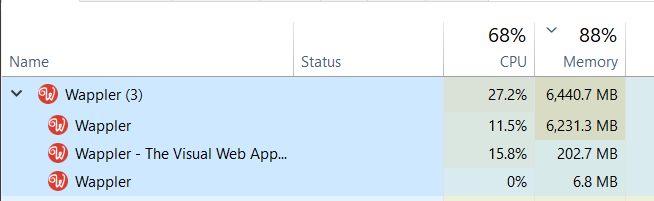
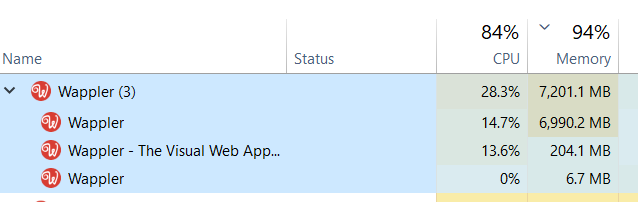
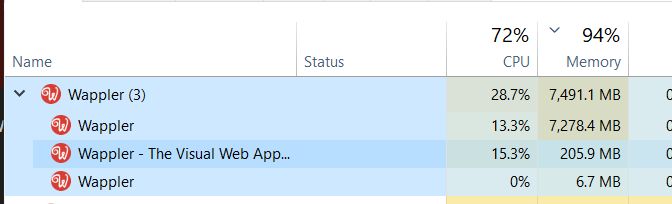
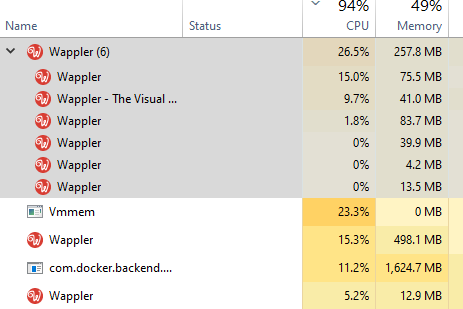
Here are some images of it pretty quickly increasing its memory usage. I have 16GB and normal run at about 50% usage.
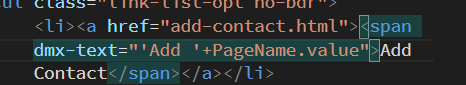
Actually, it appears to happen when I add dmx-text like the following. It works with just PageName.value, but as soon as I add 'Add ’ before I even save it freezes and starts increasing memory.
Interesting. I have seen this before in earlier versions, but usually it was because I had put in an incorrect binding which causes self-referencing.
For example, I set some GET param value in server connect as the value that would be returned by this server connect itself.
What I see here is a simple binding. Would be interested to know how Patrick is able to find and fix this.
Until now I wasn’t able to reproduce it. Is the high cpu/memory usage only within Wappler or do you also get it when opening the specific page in the browser?
Not doing anything complex. In this case, setting parameters for a conditional row. Before, this was happening when setting a dynamic event Server Connect action.
In my case, restarting Wappler fixes the issue.
Let me know if there is anything I can do to help get you the information you need to troubleshoot.