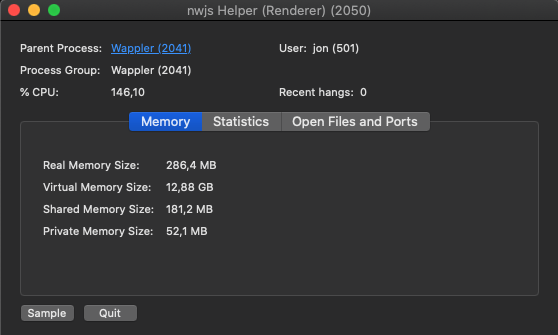
I’ve noticed lately that Wappler is power hungry. It’s just open in the background .
But it’s still stressing my laptop.

I’ve noticed lately that Wappler is power hungry. It’s just open in the background .
But it’s still stressing my laptop.

Same on Windows over the last couple of releases. Haven’t updated to the latest beta though. Think I’ll wait for the the final release of Wappler 3 before doing that…
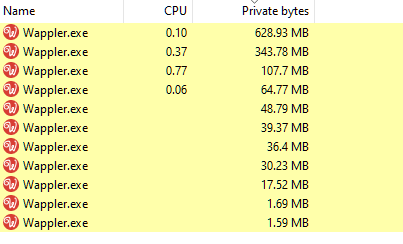
I don’t think the latest release uses more resources than usual on Windows 10:

All is fine on initial start-up but seems to use more resources the longer Wappler is idle. Later on will do a fresh install of everything as like many others have been installing one version on top of another repeatedly.
If using Wappler very heavy for long time, it’s memory usage can grow a bit more.
So advisable to do a full restart of Wappler like once a day or when you feel it is getting heavy.
Just click on the OS taskbar icon for Wappler (small icon) and choose Restart Wappler.
This will fully restart it.
Note just closing the main window will keep still a large portion of Wappler active, so better to choose the full restart option
In my case it was just after an OS restart.
But I agree with Dave.
I would say this has been going on around 3 weeks. My laptop is going to take off anytime soon.
The image you show is not the actual app. That's the parent app(the launcher). It's not the actual app. Look for an nwjs process.
I’m on an iMac (Catalina) and have been using Wappler solidly for a few hours and it’s using a tiny amount:
Yeah I get 3% from time to time. Running at 3% utilization is not the problem reported 
The problem is when it’s starts spiking out of control beyond 100% doing nothing. It’s just standing there… menacingly!
This is Gitkraken doing nothing. Gitkraken is built on top of electron(similar to Wappler).
Expected results for a program that is not doing anything.
Same for Wappler. Check that CPU time.
Both apps start on boot.
But Wappler is more demanding than my better half.
I can't see one, but the list I showed is where I've seen very high resource usage when there were issues with Wappler some time ago. I do a 'full' restart of Wappler quite often - that could be why I'm not seeing the issue.
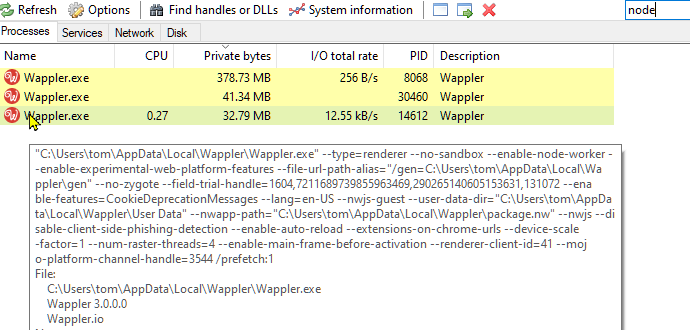
Check then for Node.js processes. I can’t remember how nwjs called their processes in windows.
If I search for 'node', three of the Wappler processes appear.

I will report back once I disable the discrete graphic cards. The external monitor is not helping me identify the culprit.
It’s Docker Desktop.
Closed it and the average load plummeted immediately and Wappler CPU utilization went to normal levels.
It seems to be the interaction between docker and Wappler. If I only have one of them running everything is OK. Why? I still don’t know.
Good finding - will investigate.
We listen to docker daemon closely through sockets so it might be more intensive indeed - but we want to know much about docker and it states 
Thanks for looking into it. I am going to do additional checks. I will downgrade some versions of Docker Desktop to see if that could be the problem. I’ve read people complaining about this problem on the latest ones.
Via docker events?