Hello Wapplers,
I would like to ask if anyone was able to implement a Wappler Chart using multiple dynamic datasets?
The datasets are changing depending on the value from the db query.
e.g.
Every user has deductions, can be Loans, cash advances, etc…
If a particular user doesn’t have any Cash Advances but only has Loans, then the dataset will be:
Dataset1: amount of Loans
If a particular user both have Cash Advances and Loans, then the dataset will be:
Dataset1: amount of Loans
Dataset2: amount of Cash Advances
Any tips and/or advise?
Thank you.
1 Like
I would suggest the easiest way would be to define two charts and use a conditional region to show the appropriate one
Hi @Hyperbytes, I just don’t want to give up yet. 
After over 2 days of trying to come up with a workaround, I found the following in Google using Chart.js.
https://codepen.io/k3no/pen/pbYGVa
I’ve used it as a template and came up with something like:
var data = { labels: [ {{months}} ], datasets: [ {{datasets_var}} ]};
And for the datasets:
{ label: "{{dataset_label}}", fill: false, lineTension: 0.1, data: [ {{dataset_data}} ], spanGaps: true, }
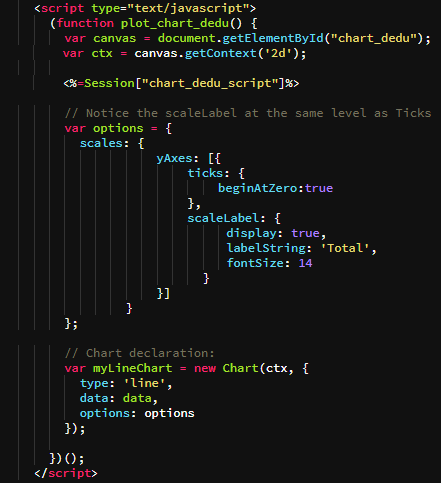
My Server Model is ASP.NET. I put the final script statement in a $_SESSION variable.
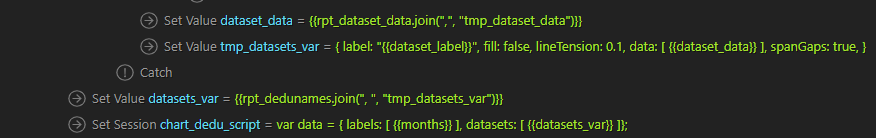
Here’s an excerpt from Server Actions:
The final script is:
I am not really knowledgeable in javascript or C# (the default page language used by Wappler for ASP.NET implementation) that is why I did it in Server Actions instead.
I don’t know if this will work in production though. And I still need to modify some chart options to add some colors.
Seems to be working, but only when the page is refreshed. New data won’t load in the chart but only after you refresh the page.
Does anyone has any advice or any workarounds?
Would there be any significant changes if I put the javascript in a separate file instead of inline and defer it?
1 Like