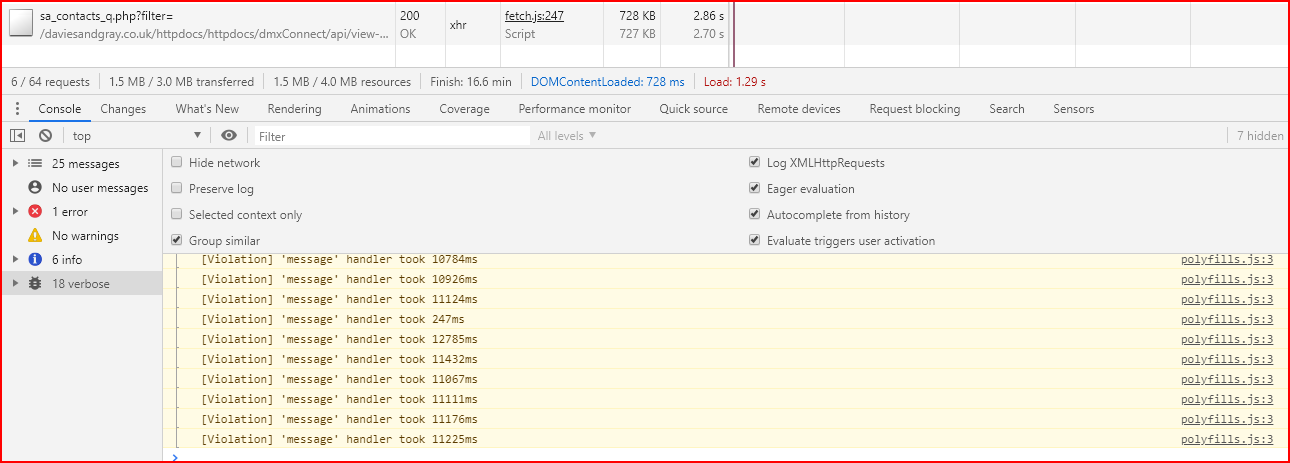
I keep getting this error repeating on one page [Violation] 'message' handler took 11225ms
It’s not stopping the page displaying but the page does take an age to load and display.
That is not an error but a warning that an event handler took very long to execute. This could slow down your page. It shows the file where the handler is located, you can click on it and it should show the line in the source file which triggered it. Is this a file from us or some third-party script?
For the long loading of the page you should check the network tab, it shows when a resource is loaded and you can check if there is some resource that blocks other resources. I notice the page has 4 MB of resources, what is so large, are these the images? Perhaps you could optimize them or use lazy load.
I had this once and realized it was because I was doing all sorts of calculating and formatting within a repeat. I moved all those calcs and formatting to the server process and everything performs much better.
But saying that, there are approx 528 records on the page because this is like a directory page.
There are next to no images (literally just one or two).
A screenshot of part of the page, and there are 528 companies returned like this. Not complicated in my mind. Maybe I've just put it together in a very inefficient way.
That is not related to google maps, the maps folder contains the source maps. There is no message event in the polyfills.js file, so the actual problem must be somewhere else.
To find slow code I always use the Performance tab in chrome devtools, record a while on your page and the check which functions are taking so long.
Is it a very large HTML with a lot of app connect expressions on it? Updating the DOM can often take some time with large HTML.
Do you have a live link for me to check or could you send me the html in a private message. With 528 repeats you probably mean 528 items to repeat or is it really 528 repeat regions?

 ). Really don’t understand what I am looking at.
 )
)