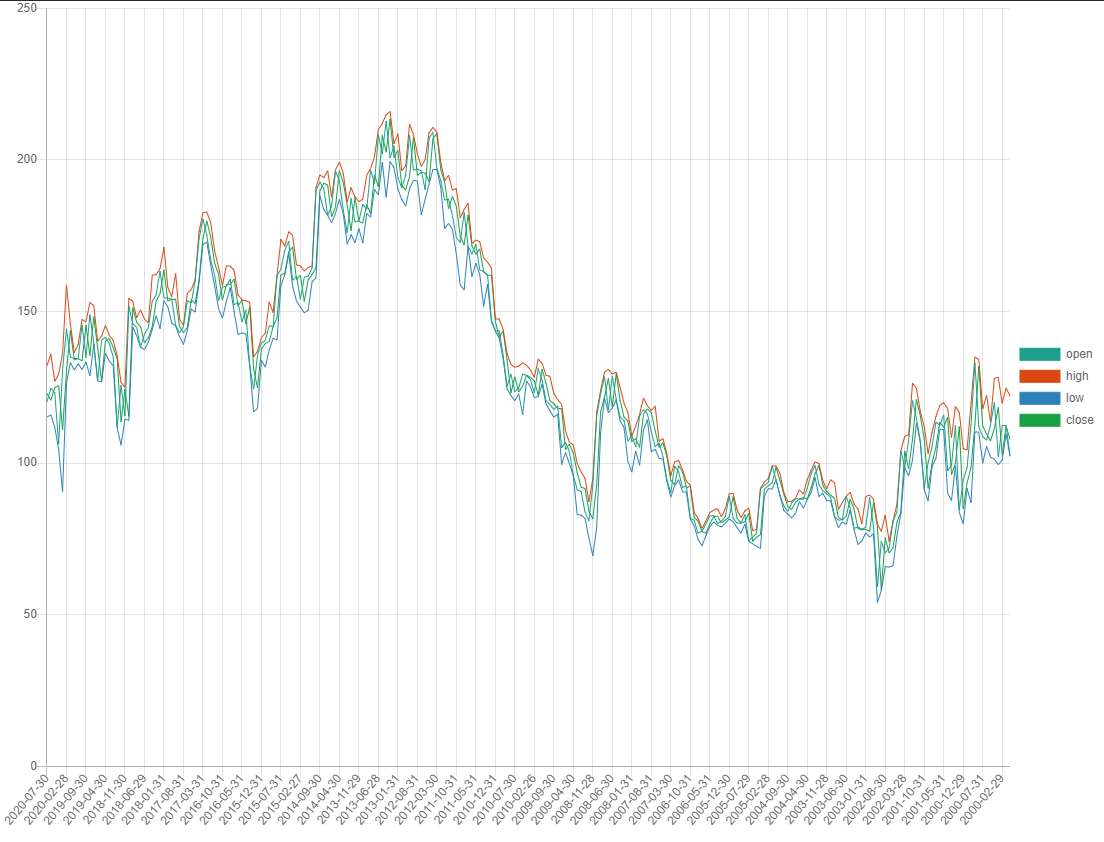
I have a simple API returning stock market values
I am tring to bind the date vale on the horizontal axis and the just the 1. open values, ideally I would like a multi-data set, but for some reason I am not getting the bar chart to visualise the values
https://www.alphavantage.co/query?function=TIME_SERIES_MONTHLY&symbol=IBM&apikey=demo
"Monthly Time Series": {
    "2020-07-24": {
        "1. open": "120.2700",
        "2. high": "132.1700",
        "3. low": "115.2000",
        "4. close": "125.7900",
        "5. volume": "93962414"
    },
    "2020-06-30": {
        "1. open": "124.6400",
        "2. high": "135.8800",
        "3. low": "115.8800",
        "4. close": "120.7700",
        "5. volume": "120928981"
    },
    "2020-05-29": {
        "1. open": "123.1900",
        "2. high": "126.9700",
        "3. low": "111.8100",
        "4. close": "124.9000",
        "5. volume": "92864791"
    },
Could someone check that they can get a chart to render with this.
Thanks.