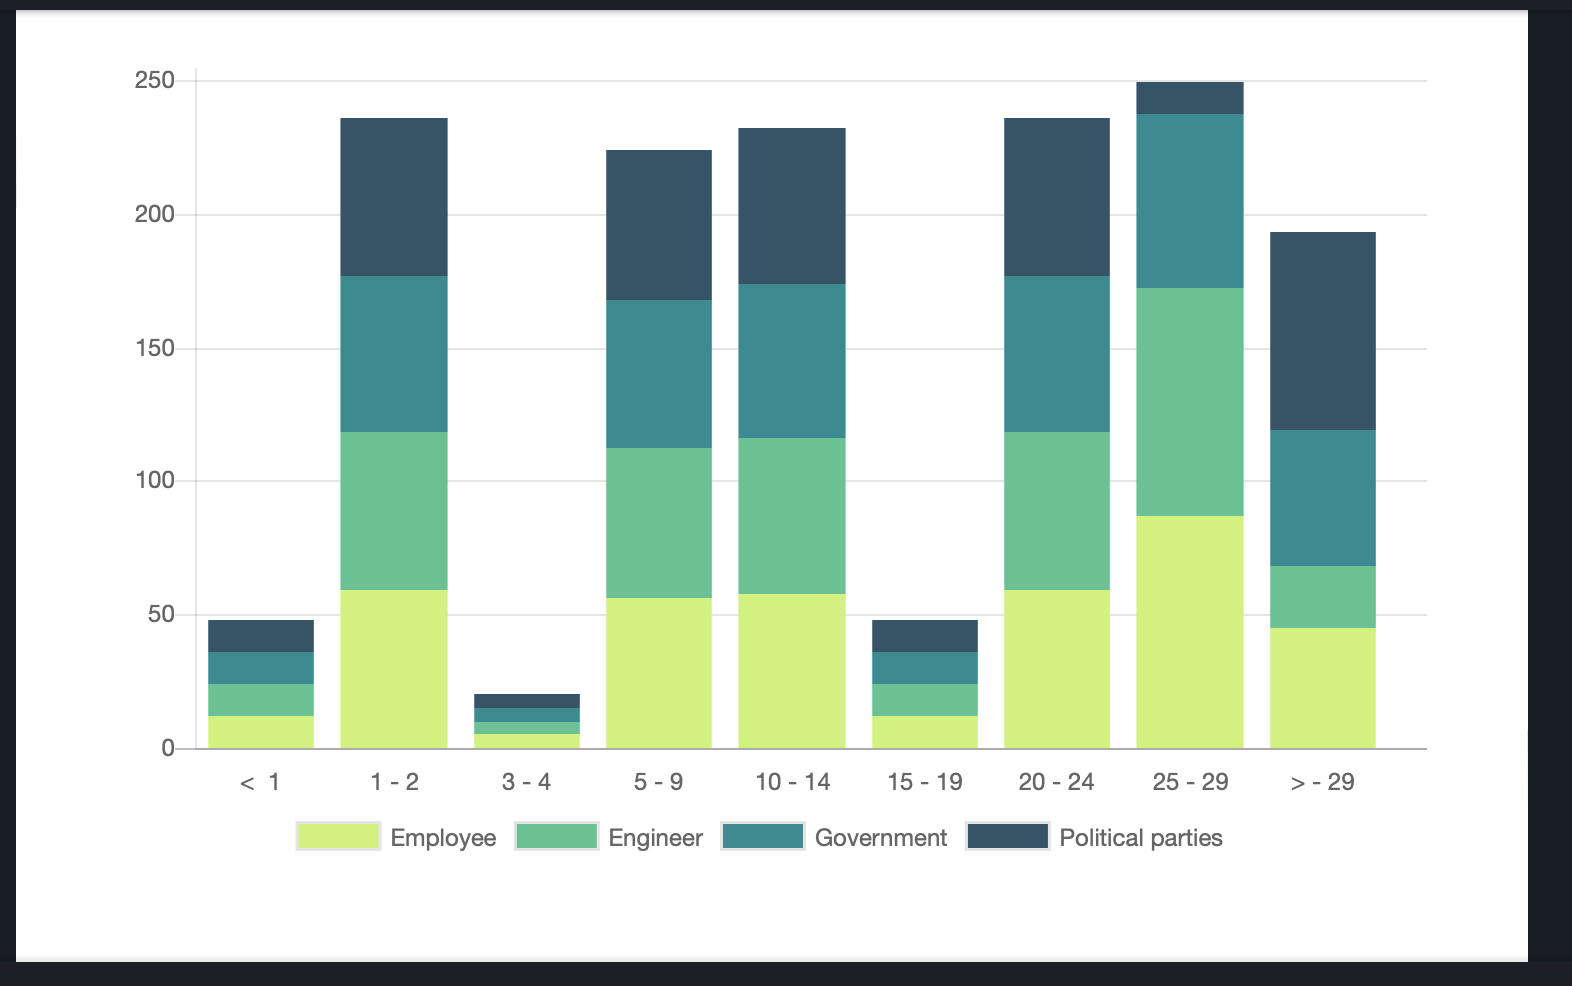
I want to create a stacked bar chart and it seems data needs to be formatted in the following way as per chart.js documentation. I just hope that is what Wappler’s flavour of the app also needs. Example:
where “data” is my x-axis age and the values are the stacked values on the y-axis
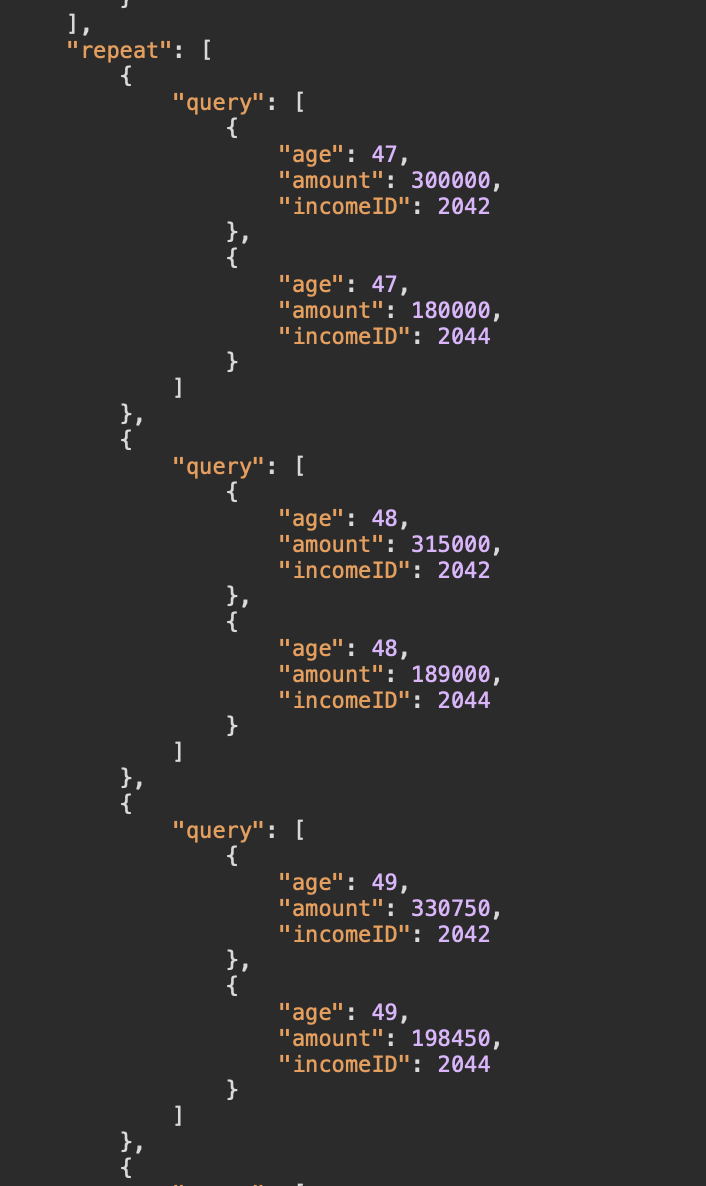
Best I can do is query all the ages and then repeat through them, but my data structure ends up looking like this and that might be the reason my graph is just a repeat of the ages on the x-axis.