Significant performance difference using Wappler API Action (SC) over our existing non Wappler build (JSON API Call)

Hi Wappler team.

We are trying to move over a search interface to Wappler that uses an API that calls an Elastic Search service within AWS.

When we use this in our existing app - we are trying to replace with Wappler the call will take 1-2 seconds MAX for the most complex query, less than 0.5 second for simple queries. When we use the exact same API call can with Wappler it can take anywhere from 8 to 16 seconds.

Is this to be expected? Is there something we can do with this? This speed level will make it impossible for our existing end users.

Noting: I have tested this on the exact same staging server size on AWS as our staging environment for existing app. Exact same query to compare, and all permissions for accessing the ES api are correct (we secure by IP address).

Maybe if you provide some information about your API and what steps/actions have you built with Wappler, we will be able to find what takes so long for them to execute.

Thanks @Teodor, sure!, I’ll try and expand on what I’ve written -

So we have an existing application (React/Symfony) that queries an AWS ElasticSearch instance via an API. This is a $GET, we use the ES DSL Query language - so when we make the call the call is always made in JSON.

This can end up being quite complex as we have 29 + filters.

However, for the sake of testing we are just using the basic match all JSON:

{
  "query": {
    "match_all": {}
  }
}

or a simple query:

{
  "query": {
    "function_score": {
      "boost_mode": "sum",
      "query": {
        "bool": {
          "must": "{{$_GET.json}}"
        }
      },
      "functions": [
        {
          "field_value_factor": {
            "field": "importance",
            "factor": 1,
            "modifier": "none",
            "missing": 1
          }
        }
      ]
    }
  },
  "track_total_hits": true,
  "size": "25",
  "from": "0",
  "_source": [
    "skills.name",
    "emails.address",
    "emails.type",
    "phone_numbers.is_primary",
    "phone_numbers.E164",
    "phone_numbers.type",
    "education.end_date",
    "education.majors",
    "education.school.name",
    "education.degrees",
    "education.start_date",
    "profiles.url",
    "profiles.network",
    "id",
    "experience.end_date",
    "experience.most_recent",
    "experience.is_primary",
    "experience.company.name",
    "experience.title.name",
    "experience.start_date",
    "experience.summaries",
    "summaries",
    "primary.name",
    "primary.location.name",
    "primary.job.end_date",
    "primary.job.company.name",
    "primary.job.title.name",
    "primary.job.start_date",
    "primary.job.start_date"
  ]
}

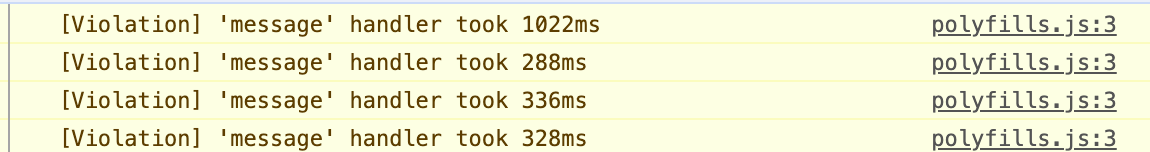
Note the $GET parameter, is a recent addition - even if I put the actual search item in there such as REACT or Javascript (if searching for those keywords) the performance remains the same when comparing.

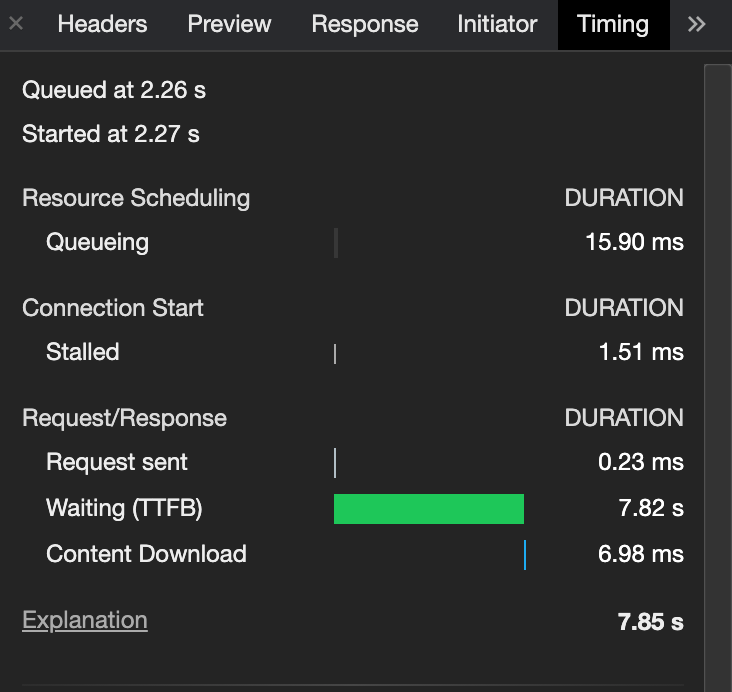
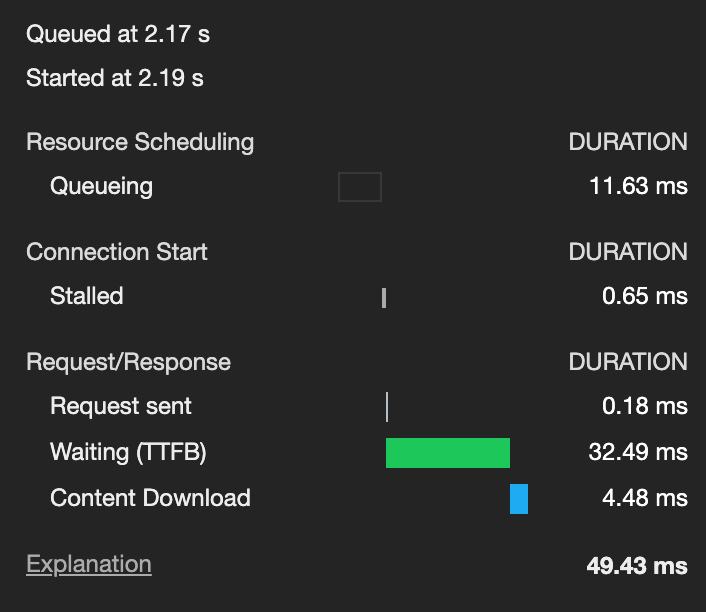
Our ES instance is XXLarge and performs well in our existing app using this exact same API.

Is that sufficient Teodor? Happy to try and provide as much information as I possible can for this.

Never seen an SC action taking 8 to 16 seconds. There can be a some overhead when you do complex manipulation with large datasets, but only calling an external API should have almost no overhead and should be close to your previous implementation.

Are you using NodeJS or PHP?

Hi Patrick.

We are using NodeJS. I’m testing using the exact same schema We send to the API, returning results to a repeat group on the page and it’s very slow compared to original implementation

Have you confirmed that the extended time is in the api execution and not the display of the data that results?

I’m not sure if something has changed in Chrome which has had a knock-on effect but recently I’ve found pages slow considerably when performing data presentation tasks. It may well not be linked but the console has quite a few polyfill warnings - typically these are much more abundant when the page is slower than in Safari for example. The data is returned quickly but something then churns away processing it.

1 Like

Yep. Just did the most basic basic query test this morning, like for like and this is the performance:

Wappler API response time - 4.29 seconds
Original implementation 679ms.

If I extend the query, or attempt to include any variables that Wappler needs to parse it typically moves into the 8+ second mark.

Can you share a screenshot of the dev tools showing what exactly takes 4+ seconds?

Yep sure, see below. This time a query with a couple more fields. Same query in original implementation less than 700ms.

Within Wappler:

Are you absolutely sure you are calling exact the same API with exact the same parameters?

Because if the API call is the same you should have close results no matter how you call it.

We do nothing else then just invoking the API call and there is no or minimal overhead in doing so. Actually you can measure the overheid by deleting the api call and execute the SC action without it to see how it performs.

Yep, calling the same API - in fact, I’m calling it directly - whereas in our original implementation we actually call the backend and then call the api - so in theory the original implementation should be a little slower.

The SC action only has this JSON API call within it, no other items.

It seems strange then, from what you say that there would be an issue - I’m not technical enough to understand why - but this is just what I’m experiencing on the same API endpoint and same call.

I’m still trying to get the call to work dynamically, so i’ll focus on that in the meantime - as I know there are a few API issues I’ve reported - perhaps if those get fixed, it will help this.

Try timing without the api call just to establish a base line

Without the API call:

You might also make the call using Postman to see what results you get without Wappler.