Haven’t had this issue before. On one of the page I am working on Safari after a minute of two of staying on the page, a message appeares saying the page is using significant energy.
I believe it’s highlighting an issue with RAM consumption. Is there anything on your page that is likely to be consuming RAM? An action based on a timer, flow loop or datetime event maybe?
It sounds like CPU usage tbh, but the rest scalaris said above are valid causes. Usually Patrick helps diagnose these issues, if you want to ping him (provide him with an online example)
Thanks @scalaris. I do have a schedular to run the logout action. But I also have that on other pages and I don’t get that message.
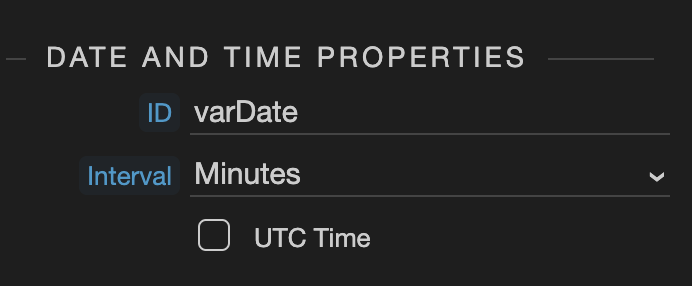
I do have a datetime var to display today’s date. I didn’t think that would take up that much ram though?
If you can share the page, I can take a look and see what’s what …
Maybe this variable is set to update every second? Just change that to hour or day.
But yes a link to your page would help.
Thanks @scalaris and @Teodor, I can’t share a link as yet, however can in paste the page code in here?
As I think Teodor mentioned you might have your scheduler and/or datetime intervals set to seconds so it runs every second.
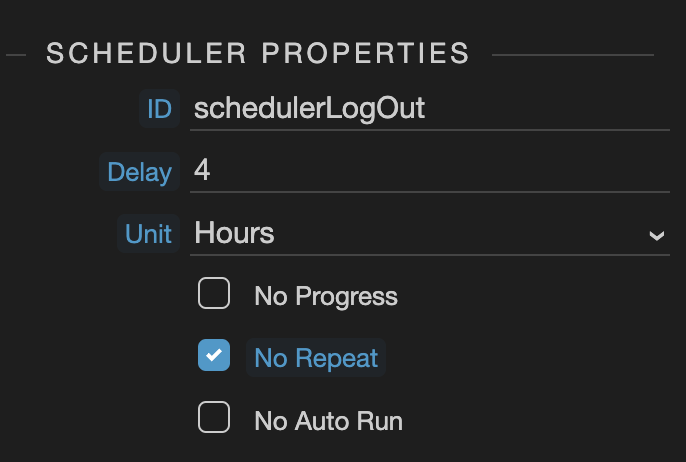
Thanks @brad for the reply and screenshot. I will check when I am at my computer again. I know the logout schedular should be okay, I used it on other pages without a problem and it’s set to 60min.
For the datetime var, is the “interval” how often it updates? Does the time stop until next update or does it tick along and does a refresh every minute/sec etc to whatever you set? I don’t
Yes, so if it is set to seconds it will update every second.
I will go back and check and see what it’s set to. But i can’t imagine it would take up that much ram? It’s just a datetime.
I doubt a 1 second timer consumes that much “energy”, it must be something else. I remember I once saw Patrick troubleshooting a page and he said a formatter was always being run that caused CPU to go high, due to the way the user used the formatter that would always look for variable updates (or something like that)
Without seeing the page in question, everything we say here is pure speculation. Issues like these are often hard to reproduce, and if you give us the page code, well, that page code has to run so that we can check for ourselves the CPU usage 
It looks like it was a datetime var like all of your suggested, it was set to seconds (default)! Thanks. very much @scalaris @Apple @brad @Teodor.
Just a question for the datetime interval, what happens to the time between those intervals. Does it stay stationary/unchanged until the next interval update, or does it continue counting as normal and does a re-sync when every interval?
The datetime will be checked regularly between the intervals (on animation frame) but it will not update anything within the app until the next interval, also it pauses when the tab is not active. It is the actual data/state update after the interval that is heavy, it then goes along all components on the page to see if they need an update.
Thanks @patrick for the detailed explanation, makes sense to me now! Appreciate your reply.
@Patrick it looks like the issue hasn’t resolved. I think it has something to do with the dependant dropdowns that I have? It started after I implemented it. I only have less than 50 records in the DB so a bit surprising its happening. Is there a way to find out perhaps which server action/code that’s causing the load?
The best thing you can do is to provide a link to your page.