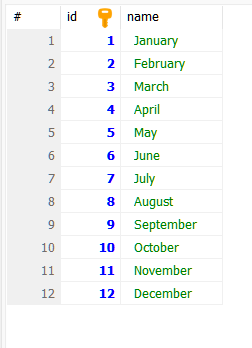
The data is coming from a table join with a ‘months’ table (id name):
and an archive table that lists our data (MariaDB/MySQL) from the ‘DateUpdated’ field.
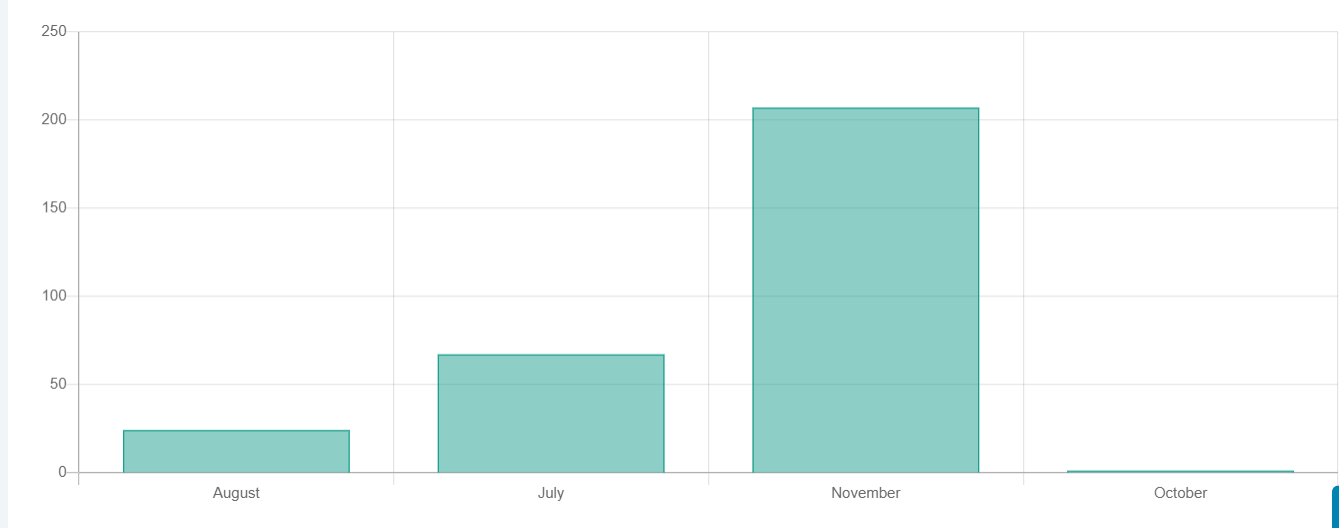
So… I’ve joined the months table to the archive table and this works but it really should show all months, even if they have zero data. I’ve tried every iteration of the SQL and cant get the ‘empty’ months to show on that chart - can someone take a look for me please?
Heres my working SQL statement:
SELECT months.id AS X, COUNT(*) AS Y
FROM months
LEFT JOIN thearchive ON months.id = MONTH(DateUpdated)
WHERE YEAR(DateUpdated) = '2023'
    AND CID = '12233'
GROUP BY months.id;
SELECT months.id AS X, COUNT(thearchive.DateUpdated) AS Y
FROM months
LEFT JOIN thearchive ON months.id = MONTH(thearchive.DateUpdated)
                     AND YEAR(thearchive.DateUpdated) = '2023'
                     AND thearchive.CID = '12233'
GROUP BY months.id;
@kfawcett That’s it…!!! Many many (MANY) thanks for that! Im not sure if I’d have gotten to that solution on my own. Great work
@Apple I was starting to think the ‘problem’ may have been something like this but @kfawcett found out it wasnt thanks for your help though, appreciate your input.
That is the case, when all the points to be plotted on X axis are not part of the result set, or have null as value.
Have used RunJS in multiple such occasions.
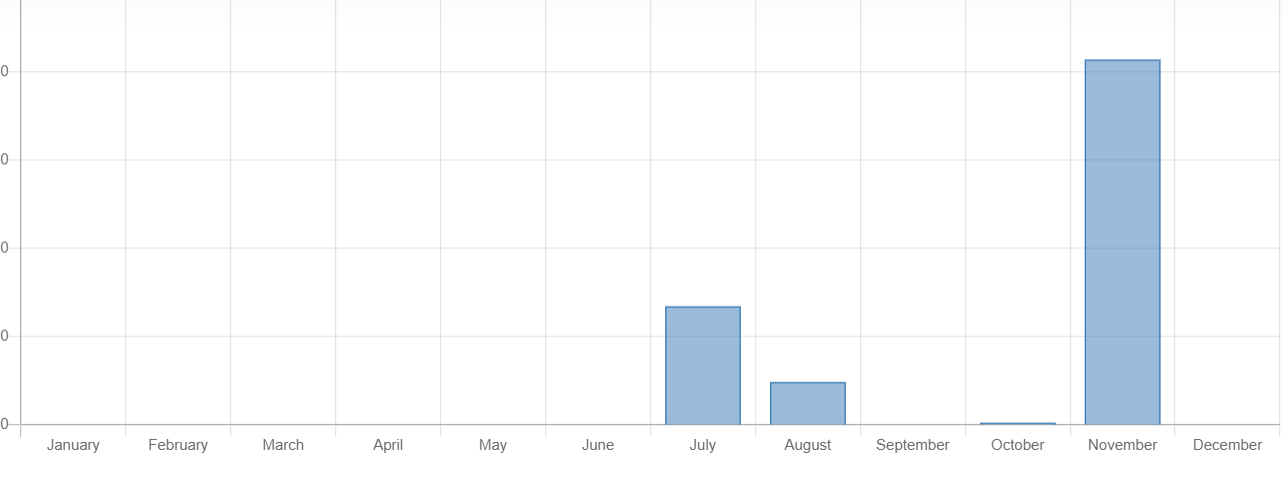
In this case, since count would return 0 instead of null, the graph renders well.
Just one more quick question if I may @kfawcett@Apple , what about trying a ‘between date range’ query using the above but using something like this so we could show the year on the chart starting at July 2023 and ending in the January 2024 :
AND thearchive.DateUpdated BETWEEN '2023-07-01' AND '2024-01-31'
The above only shows the chart starting at January
You’ll probably need to replace dates and nums with parameters, but hopefully this gives you a working example.
SELECT months.id AS X,
       IFNULL(SUM(CASE WHEN thearchive.DateUpdated BETWEEN '2023-07-01' AND '2024-01-31' THEN 1 ELSE 0 END), 0) AS Y
FROM months
LEFT JOIN thearchive ON months.id = MONTH(thearchive.DateUpdated)
                     AND YEAR(thearchive.DateUpdated) IN (2023, 2024)
                     AND thearchive.CID = '12233'
WHERE months.id >= 7 OR months.id <= 1
GROUP BY months.id
ORDER BY CASE WHEN months.id >= 7 THEN 0 ELSE 1 END, months.id;