I’d like to be able to get of the numbers and/or percentage of loaded/loading data (records).
Hi. I haven’t seen regular JSON data getting fetched in parts - in Wappler or otherwise.
Is this even possible?
For file downloads there can be a download status (and Wappler probably supports it), but for regular data, I haven’t seen.
Unfortunately JSON data can’t be streaming as it has to be fully received before processing.
So it’s not possible to have records based progress.
You can make a progress based on the bytes downloaded.
But usually JSON data is not that big and almost instantly downloaded so a simple loader animation is more than enough.
We have bigger data being loaded in CMS. How can access the downloaded bytes? By the server connect’s download process?
Having a feedback like “x% of Data loaded” in a progress bar would be fine.
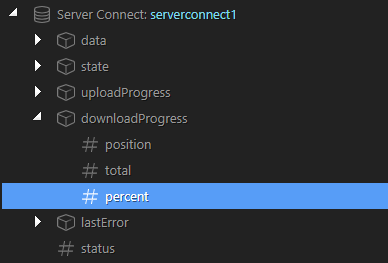
Just use the server connect data properties:
Thanks George, I’ll give it a try 
After second thought - JSON data is dynamically generated. So it has an underterminate length.
So the progress percentage will be probably 0
How big are your JSON files? Usually the downloading is so fast that a simple loading spinner i just enough
In this case aboout 20 mb
20 MB of JSON data? Are you sending the whole database with images inside? Because that is huge amount of data
Ah sry no, 20 seconds for loading, but we have to check some selects there (could be more of a db-related issue), I mixed that up.
We do have a progress bar for the execution state, that works fine. I would just have been nice to show up some more info to the user while the data is loading.
20 seconds of loading is also very slow - why is that? How much data are you loading? Is the network slow?
Maybe is not the data that is slowing you but just a slow server / database? So server processing is a bottleneck?
No, we have 3500 records but have some sub-selects that count the number of fotos, files and videos from related tables.
So how big is the final JSON data send over? You can see that in the browser DevTools in the Network tab.
984 kb, took 10 seconds.
That’s the sql-Statement, maybe you have a better approach? Any suggestions are welcome 
SELECT
	concat_ws(
		'',
		`news`.`NEWSID`,
		' ',
		`news`.`NewsDatum`,
		' ',
		`news`.`NewsTitel`
	) AS `Searchfield`,
	`news`.`NewsTitel` AS `NewsTitel`,
	`news`.`NewsDatum` AS `NewsDatum
	( SELECT count( 0 ) FROM `news_fotos` `foto` WHERE ( `foto`.`NEWSID` = `news`.`NEWSID` ) ) AS `AnzahlFotos`,
	( SELECT count( 0 ) FROM `videos_relations` `video` WHERE ( `video`.`NEWSID` = `news`.`NEWSID` ) ) AS `AnzahlVideos`,
	( SELECT count( 0 ) FROM `files_relations` `file` WHERE ( `file`.`NEWSID` = `news`.`NEWSID` ) ) AS `AnzahlFiles`,
	`news`.`NewsDatum` AS `NewsDatum
FROM
	`news`
ORDER BY
`news`.`NewsDatum` DESCOh now I see - so the download of the data isn’t any problem and it should take probably a second maximum. So there is absolutely no need for download progress.
What you have is clearly a heavy, not optimized sql statement indeed. You should definitely tweak your sql query to return instant results. There are different tools for this depending on your database.
You should make sure you have keys and indexes on all the table linking fields and also on the sorting fields.
Maybe @Hyperbytes can advise
Thanks George. I do have indexes on the fields, which already helped a lot.
Just about to leave the office but will certainly look later. I have much bigger data sets loading in sub 1 second times for example the following loads in about 1 second over about 2000 records (will increase to around 10k when project complete)
SELECT roomtypes.RoomType, roomprices.Checkin, roomprices.Weeks, roomprices.Price, hall.Account_Name, agent.Account_Name AS Agent, hall.complete AS HallComplete, rooms.RoomID, roomimages.imageName AS RoomImage, roomimages.RoomID AS ImageRoom, roomimages.ID AS ImageBuilding, rooms.complete AS RoomComplete, buildingimages.imageName AS HallImage, hall.ID AS HallID, rooms.Description AS RoomDescription, hall.Description AS HallDescription, hall.City, agent.ID AS AgentID, roomprices.AcademicYear, hall.lat, hall.lng, roomprices.PriceID, icons.iconName
FROM roomprices
INNER JOIN roomtypes ON (roomtypes.RTID = roomprices.RoomType) INNER JOIN agents AS hall ON (hall.ID = roomprices.BuildingID)
INNER JOIN agents AS agent ON (agent.ID = hall.ParentID) INNER JOIN rooms ON (rooms.RoomTypeID = roomprices.RoomType AND rooms.ID = hall.ID)
LEFT JOIN roomimages ON (roomimages.RoomID = rooms.RoomID)
LEFT JOIN buildingimages ON (buildingimages.ID = hall.ID)
LEFT JOIN icons ON (icons.IconID = hall.IconID)
WHERE roomimages.featured = 1 AND buildingimages.featured = 1 AND hall.City LIKE :varSearchcity AND rooms.complete = 1
ORDER BY roomprices.randomiser ASC"
I see no reason why this should be so slow from what I can see
Perhaps you could outline your data structures for me or better upload some sample data in zipped .sql format for me to work with?
I assume this is not a Wappler query manager generated query, is it a custom view?
Thanks for your help. I’ve checked all the tables again and reapplied the indexes. This lead to a dramatic gain in speed. The problem seems to be solved.
1 Like
So when you have big delays - it is always good to search for the real cause, instead of masking them behind a progress bar
5 Likes