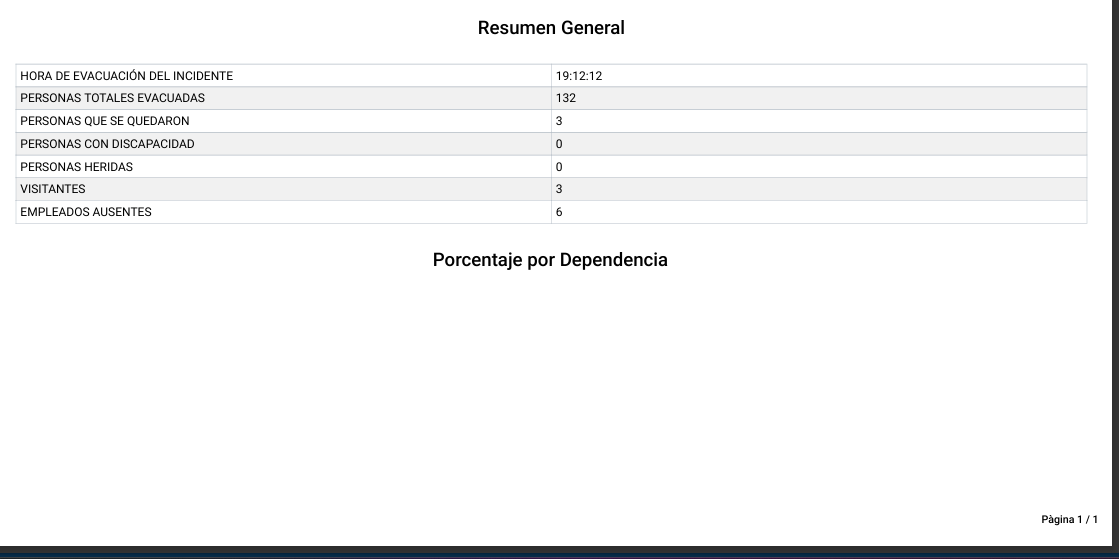
I have a problem to include and print a chart (Chart.js) from the pdfCreator, it prints all the content, but the chart part is empty (In the screen the chart has no issues)
This is the pdfCreator definition
<dmx-pdf-creator id="pdfcreator1" content="#pdfcontent1" page-size="A3" dmx-bind:page-margins="[20,120,20,30]">
    <dmx-pdf-header id="pdfheader1" dmx-bind:margin="[5,5,5,5]">
        <dmx-pdf-image id="pdfimage1" src="/assets/images/brigadistas.png" height="120" fit="true"></dmx-pdf-image>
    </dmx-pdf-header>
    <dmx-pdf-style id="pdStylTextWhite" name="textWhite" font-size="9" dmx-bind:alignment="'left'" decoration-color="#1C2851"></dmx-pdf-style>
    <dmx-pdf-footer dmx-bind:margin="[10,5,5,30]" id="pdfFooter2">
        <dmx-pdf-text text="Gestión Automatizada de los Procesos de Recursos Humanos -GAPRH-" alignment="center" fontsize="7" bold="true" font-size="8"></dmx-pdf-text>
    </dmx-pdf-footer><dmx-pdf-footer dmx-bind:margin="[5,5,10,5]" id="pdfFooter1">

        <dmx-pdf-text text="Pàgina ##page## / ##total##" alignment="right" fontsize="7" bold="true" font-size="8"></dmx-pdf-text></dmx-pdf-footer>
</dmx-pdf-creator>
This is the pdfcontent1
<div class="col" is="dmx-pdf-content" id="pdfcontent1" remove-extra-blanks="true" show-hidden="true" remove-tag-classes="true" table-auto-size="true">
            <div class="row">
                <div class="col text-end">
                    <button id="btnGenPdf" class="btn btn-sm btn-danger" dmx-on:click="pdfcreator1.open()">
                        <i class="fa-solid fa-file-pdf"></i>
                    </button>
                </div>
            </div>
            <div class="row mt-2">
                <div class="col">
                    <div class="lh-1 small table-responsive">
                        <table class="table table-striped table-bordered table-hover table-sm">

                            <thead>
                                <tr>
                                    <th class="table-info bg-info bg-opacity-75 text-center w-25">Fecha hora inicio</th>
                                    <th class="table-info bg-info bg-opacity-75 text-center">Tipo evento</th>
                                    <th class="table-info bg-info bg-opacity-75 text-center">Nombre</th>
                                    <th class="table-info bg-info bg-opacity-75 text-center">Observaciones</th>
                                </tr>
                            </thead>
                            <tbody dmx-generator="bs5table" id="tableRepeat2">

                                <tr>
                                    <td dmx-text="srvcnnEventoEmergencia.data.qryLastOpenEmerEvent.fecha_hora_inicio.formatDate('dd/MM/yyyy HH:mm:ss')"></td>
                                    <td dmx-text="srvcnnEventoEmergencia.data.qryLastOpenEmerEvent.tipo_evento_nombre" class="text-center"></td>
                                    <td dmx-text="srvcnnEventoEmergencia.data.qryLastOpenEmerEvent.nombre" class="text-center"></td>
                                    <td dmx-text="srvcnnEventoEmergencia.data.qryLastOpenEmerEvent.observaciones" class="text-center"></td>
                                </tr>
                            </tbody>
                        </table>
                    </div>
                </div>
            </div>
            <div class="row">
                <div class="col">
                    <div class="row mt-2">
                        <div class="col">
                            <h6 class="fw-bold text-center">Reporte General de Evacuación por Incidente</h6>
                        </div>
                    </div>
                </div>
            </div>
            <div class="row">
                <div class="col">
                    <div class="table-responsive lh-1 small">
                        <table class="table table-striped table-bordered table-sm">
                            <thead>
                                <tr>
                                    <th>Dependencia</th>
                                    <th scope="row">Nivel</th>
                                    <th>Total</th>
                                </tr>
                            </thead>
                            <tbody is="dmx-repeat" dmx-generator="bs5table" dmx-bind:repeat="srvcnnEventoEmergencia.data.cstmReportegeneralEv" id="tableRepeat3">
                                <tr>
                                    <td class="textWhite" dmx-text="nombre"></td>
                                    <td class="textWhite" dmx-text="nivel"></td>
                                    <td class="textWhite" dmx-text="evacuados"></td>
                                </tr>
                            </tbody>
                        </table>
                    </div>
                </div>
            </div>
            <div class="row mt-2 g-0">
                <div class="col">
                    <div class="row mt-2">
                        <div class="col">
                            <h6 class="fw-bold text-center">Resumen General</h6>
                        </div>

                    </div>
                    <div class="row">
                        <div class="col">
                            <div class="table-responsive lh-1 small">
                                <table class="table table-striped table-bordered table-sm">
                                    <tbody is="dmx-repeat" dmx-generator="bs5table" dmx-bind:repeat="srvcnnEventoEmergencia.data.cstmResumen" id="tableRepeat4">
                                        <tr>
                                            <td class="textWhite" dmx-text="label"></td>
                                            <td class="textWhite" dmx-text="valor"></td>
                                        </tr>
                                    </tbody>
                                </table>
                            </div>
                        </div>
                    </div>
                </div>

            </div>
            <div class="row mt-2 text-center">
                <div class="text-center col-auto">
                    <h6 class="fw-bold text-center">Porcentaje por Dependencia</h6>
                    <dmx-chart id="chrtResumenEvento" dataset-1="" colors="colors5" point-size="" type="pie" dmx-bind:data="srvcnnEventoEmergencia.data.chrtPieResumenEv" labels="nombre" dataset-1:label="Evacuados X dependencia" dataset-1:value="total" cutout=""></dmx-chart>

                </div>
            </div>
        </div>
I even tried with ApexCharts, here I have an error (In the screen the Apexchart has no issues and I did not use any font definition in the pdfStyle)
<div class="row">
                <div class="col text-center">
                    <div class="textWhite border border-1 col-6 rounded">
                        <div id="evacuadosByDepApex">

                        </div>
                    </div>
                </div>
            </div>
Uncaught (in promise) Error: Font 'Helvetica' in style 'normal' is not defined in the font section of the document definition.
FontProvider.provideFont @ fontProvider.js:52
(anonymous) @ textTools.js:326
¿Is it possible to include charts in the pdfCreator?