Hi everybody,
I need to display a pie chart of total users.
Some of them are regular ones, others admins and/or responsable. I used boolean values (true/false) in DB to set they are admins and/or responsables.
How should I do to count and display this?
Thanks
Other question.
How should I do if I want to display the count of users created (I assume i have a created field in my table) day after days (or week)?
Is there somewhere any documentation on how to use charts? I mean dealing with datas in chart.
Thanks for your help.
The way I have done not sure if it’s the best but works for me.
I set up queries then set values to count the numbers of items of in a query using the .count().
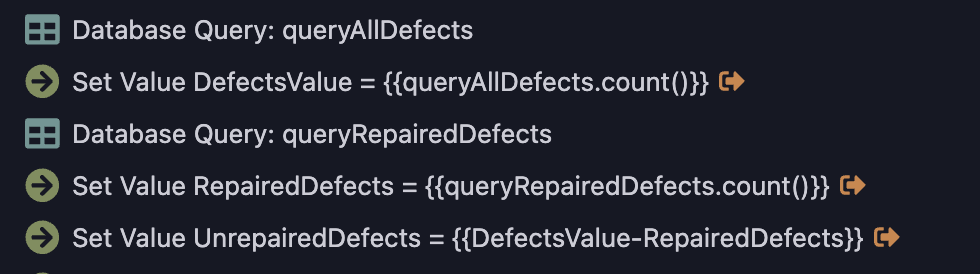
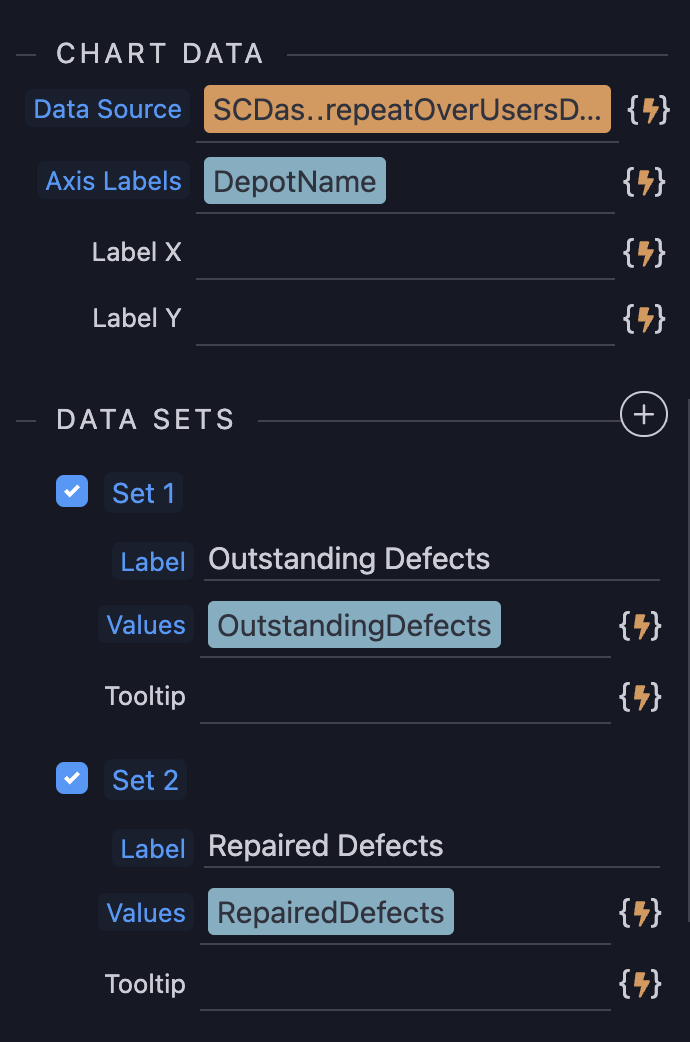
Then add a chart element to your page and use the set values as the set data.
Using this I ended up with

1 Like
Thanks for your answer.
I just tried without succes.
I think i’m missing something with the data source… I don’t know wich query I should select, or if should select the SC or SC.data - depending of it I can or can’t bind the values I just setted.