Hi Guys,
Thank you in advance for your assistance. The community has been a tremendous resource getting to the point that I have and I've tried searching for possible published solutions, but nothing has worked so far. I'll try to give all the pertinent info I can, but please let me know if you need something else.
I've built a simple web app with PostgreSQL backend, it worked perfectly when local development but now that I've pushed it online the API actions 50/50 get status 302 and fail. If I just press the button again, they often succeed.
Wappler 6.8.0 Pro Stable
Windows 11
Chrome, Brave and Edge browsers all show same behavior even on different computers.
Hosted on Digital Ocean (DO) App platform NodeJS
Digital Ocean managed DB PostgreSQL
Domain through Cloudflare (in Development Mode and site protection is paused) DNS Cache is flushed so I should be going directly to Digital Ocean and Cloudflare not interfering.
Security Provider uses Database type with two tables (user & user_roles).
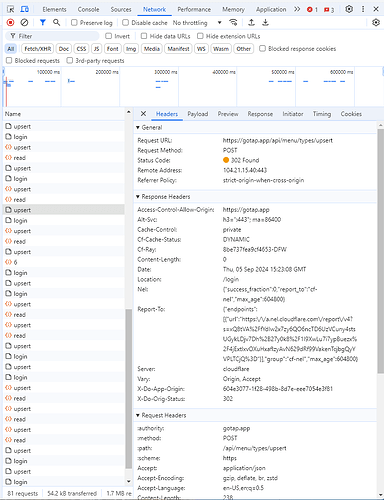
The problem seems to appear only when using the DO hosted front-end. If I use Localhost webpages with the DO DB, everything works as expected. If I call the API directly from the browser URL field, they always succeed. However when using my regular app when I try to call an Upsert API (server connect form) to add an item, I often have to submit the form twice or more often before it succeeds. Sometimes they work 5 times in a row and sometimes it fails 5 times in a row, most often every other attempt works.
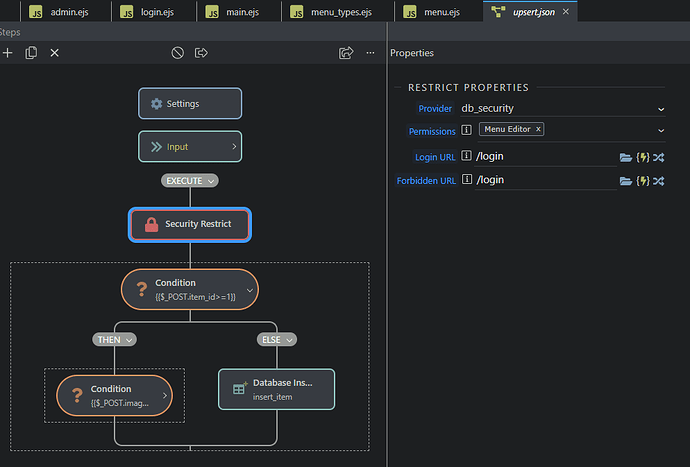
One difference I notice in the failed attempts: failures get 302 status (I'm guessing that's due to my security restrict as the first step of my API Action.?) and the Content Length is 0, while a successful attempt gets Status 200 and content-length 2.
My first guess is something is not happy with the security provider because every time it fails I get sent /login probably from the first step Security Restrict of my API action. What doesn't make sense is why a subsequent attempt succeeds.
I've watched the DO runtime logs, but they aren't easy to read because they're not in sequential time order and I can't find any smoking gun failures, restarts, etc.. When an attempt fails it looks like this:
[gotap] [2024-09-05 18:42:55] 2024-09-05T18:42:55.521Z server-connect:router Serving serverConnect /api/menu/items/upsert
[gotap] [2024-09-05 18:42:55] 2024-09-05T18:42:55.524Z server-connect:app Executing action step restrict
[gotap] [2024-09-05 18:42:55] 2024-09-05T18:42:55.524Z server-connect:app options: {
[gotap] [2024-09-05 18:42:55]   provider: 'db_security',
[gotap] [2024-09-05 18:42:55]   permissions: [ 'Menu Editor' ],
[gotap] [2024-09-05 18:42:55]   loginUrl: '/login',
[gotap] [2024-09-05 18:42:55]   forbiddenUrl: '/login'
[gotap] [2024-09-05 18:42:55] }
**[gotap] [2024-09-05 18:42:55] 2024-09-05T18:42:55.525Z server-connect:auth No login cookie found**
[gotap] [2024-09-05 18:42:55] 2024-09-05T18:42:55.526Z server-connect:output restrict: undefined
And when I look at successful upsert attempts the line: "No Login cookie found" doesn't appear nearby. However when I check cookies in the dev tools, they're always there. I'm not re-logging in between button presses so I can't figure out why login cookies would be missing, then suddenly there one second later. There are two session cookies, one for .gotap.app and one for gotap.app (missing the starting .) both have HttpOnly set and secure un-set.
Perhaps this is similar to the DO App Platform and security provider topic, but it is unanswered. As you can tell I'm flailing and rather lost. Your assistance is much appreciated. Thanks again!
Micah


