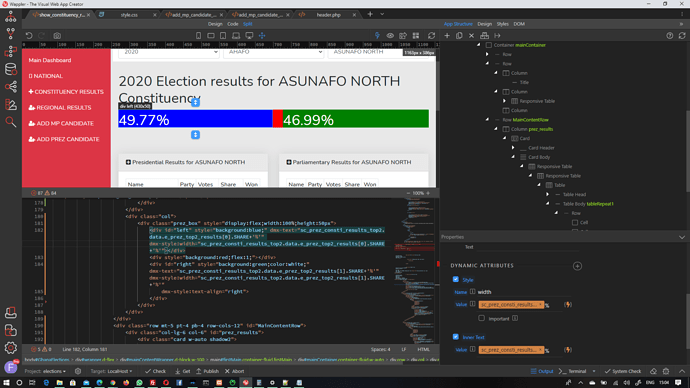
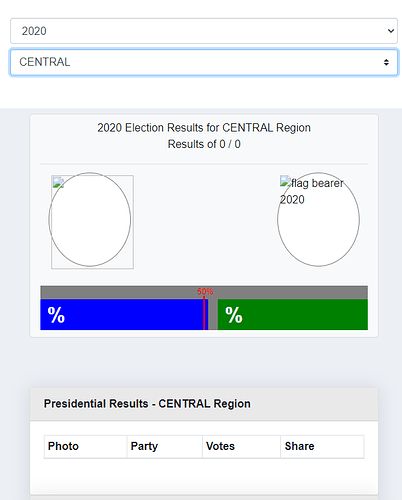
Good day everyone. I need some help to create something like this within Wappler.
I have my query returning top two candidates and will like to display the output this way.
The chart can be simply created using flexbox, create a flex container and add 3 divs. Here a sample:
<div style="display:flex;width:500px;">
     <div style="background:blue;color:white;width:53.73%;">53.73%</div>
     <div style="background:grey;flex:1;"></div>
     <div style="background:green;color:white;text-align:right;width:44.53%;">44.53%</div>
</div>
The above is only a sample on how to create it, you should put the styles in a css and created some classes for them. Also it would require some extra styling to look nice. I hope that this helps you further.
Thanks a million times Patrick.
Please see the attached image. I got the left and right to display the data alright, but I am having onw issue.
- How do I get the center div (red area) to stay absolutely between left and right bars. as 50%.
I have attached the code below.
The center div will always fill the gap between the other 2. You could place an extra divs absolute positioned inside it. Here a sample with a bit more styling and a line at 50%;
<div style="display: flex; width: 500px; position: relative; padding-top: 20px; font-family: Arial;">
    <div style="position: absolute; left: calc(50% - 1px); width: 2px; top: 15px; height: calc(100% - 15px); background:red;"></div>
    <div style="position: absolute; left: calc(50% - 10px); width: 20px; font-size: 12px; top: 0; color: red;">50%</div>
    <div style="background: blue; color: white; width: 53.73%; box-sizing: border-box; padding: 5px;"><b>53.73%</b></div>
    <div style="background: grey; flex: 1;"></div>
    <div style="background: green; color: white; text-align: right; width: 44.53%; box-sizing: border-box; padding: 5px;"><b>44.53%</b></div>
</div>
Definitely bookmarking this for future! Thanks!
It’s sort of CSS virtuosity. 
Probably the expression for the class toggle is wrong and evaluates to false. Set the expression to true to see if the class works, if that works check your original expression, is the PARTY property really a string and does it start with the value you are checking.
Hello @patrick I am back to this again. The issue is that uppon selecting a different region which does not yet have data, the blue and green bars i.e widths do not vanish or change size. They seem to be maintaining the state of the previous widths. How can I get bars to change to a default color like grey or black when there are no values for widths.
Hey everyone…Trying to do a similar presentation. In this example I query 2 values, percent and percent_remaining and plan to use them to build this dynamic display. For some reason I am unable to get the dynamic values (width) to populate. Dynamic Inner text works properly on the first display. (Second % is hard coded for now)
Here is what I get on the client.

Thanks!
Thanks, used code you provided as a staring point with a new flex grid.
                                <div style="background-color:blue;color:white;width:500px;" dmx-style:width="customer_stats.data.percent+'%'">{{customer_stats.data.percent.formatNumber(0, '.', ',')}}%</div>

                                <div style="background-color:grey;text-align:right;color:white;" dmx-style:width="customer_stats.data.remaining_percent+'%'">{{customer_stats.data.remaining_percent.formatNumber(0, '.', ',')}}% </div>

                            </div>
![]()
Now, working as intended, w/dynamic population.


