
Hi
was hoping there might be someone on here who could help me out briefly. I am trying to make a bar chart that has columns of 2 data sets. what I mean is I have 2 warehouses, and, I want to show the volume used in each warehouse for each month
so i have this sql with the dataset returned, you see it has the months and the warehouse name and the volume stored.
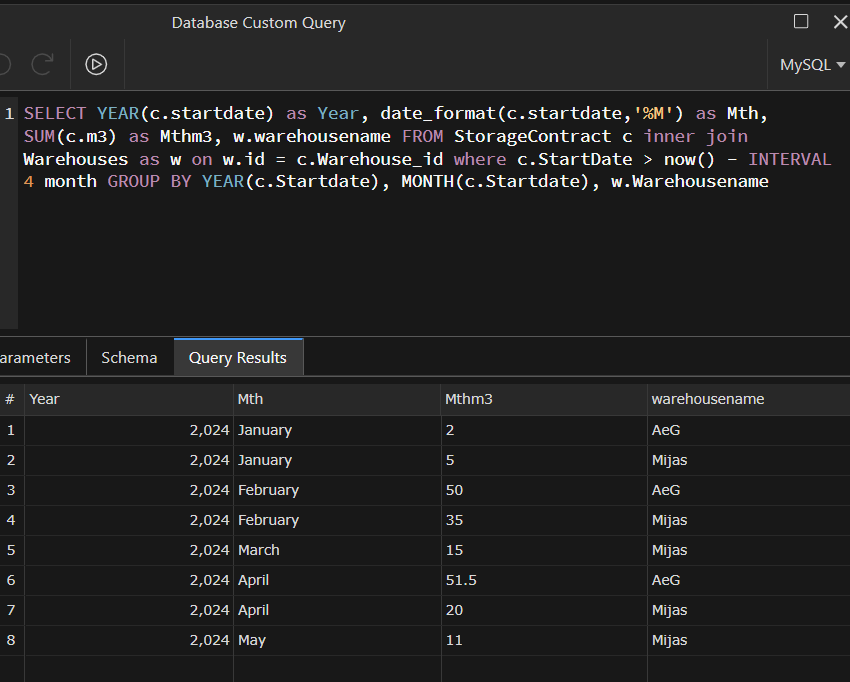
looks like this at the moment
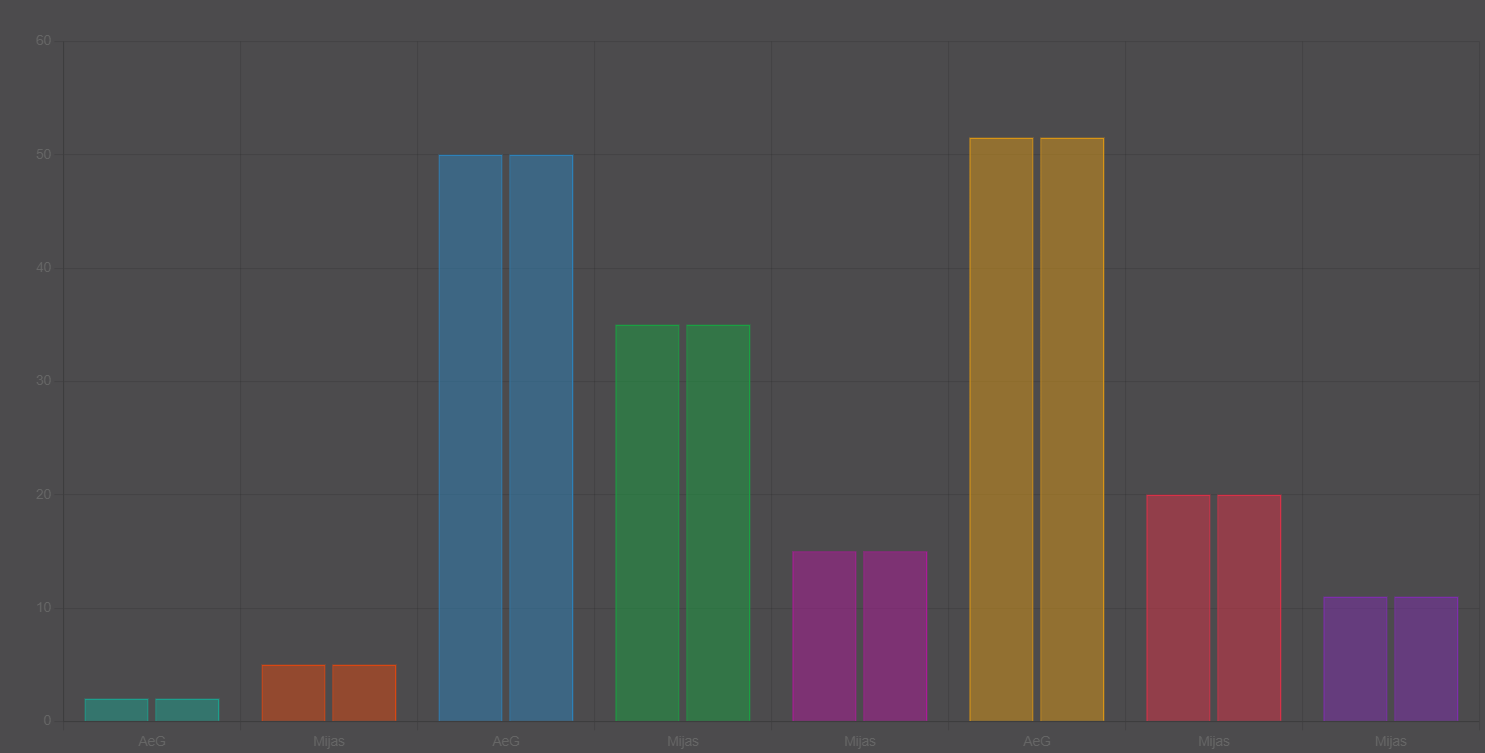
the code I have (which is very wrong of course) is
<dmx-chart id="chart4" responsive="true" point-size="" type="bar" multicolor="true" dmx-bind:data="SC_m3ByWarehouseByMonth.data.query" labels="warehousename" label-y="SC_m3ByWarehouseByMonth.data.query.Mth" dataset-1:value="Mthm3" dataset-2:value="Mthm3"></dmx-chart>
i have been looking at 2 data sets etc, but can’t get my head around it, not sure if my sql returns a data set that it does not understand or i have chart setup wrong. the data set has all the right data elements etc.
thanks in advance