Hi all wapplers !
Is there a way to see what’s in my variables with the dev tool of chrome or firefox ?
I’d like to to check with values are setted in.
Thank’s
Hi all wapplers !
Is there a way to see what’s in my variables with the dev tool of chrome or firefox ?
I’d like to to check with values are setted in.
Thank’s
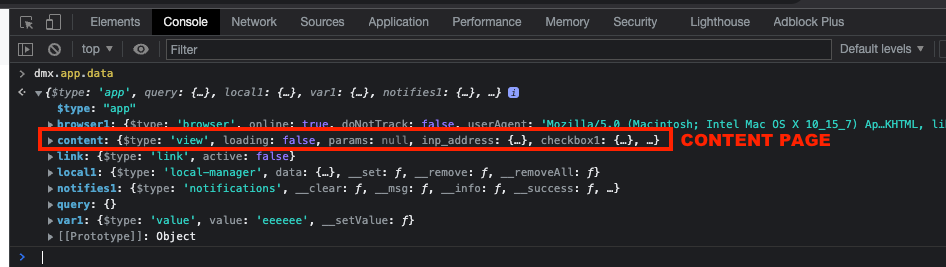
Well just open the browser dev tools, go to the console and enter:
dmx.app.data
And you can expand all the app connect data on the page and explore it.
so easy, thanks a lot!
@George that’s just what I needed to know as well. Thanks.
Are there any other simple little tricks like this that you can share with us?
That does look like useful information!
And if you have a variable called my_var, you can type
dmx.app.data.my_var
which is super useful.
QUESTION: Is there a way for the display of my_var to be continuously updated without needing to keep typing in dmx.app.data.my_var...?
Yes, use live expressions in your dev tools 
https://developers.google.com/web/tools/chrome-devtools/console/live-expressions
Wow… that is super useful @Teodor… thank you!
Been working with a node design and it seems to need the word content inserting…
dmx.app.data.content.my_var