Just started with my first cron job, and I’m curious how I can see the output?
Normally I’d go to the browser and open the API action there, to see what it outputs (either in the network tab or just by loading the URL to the API action itself).
For example:
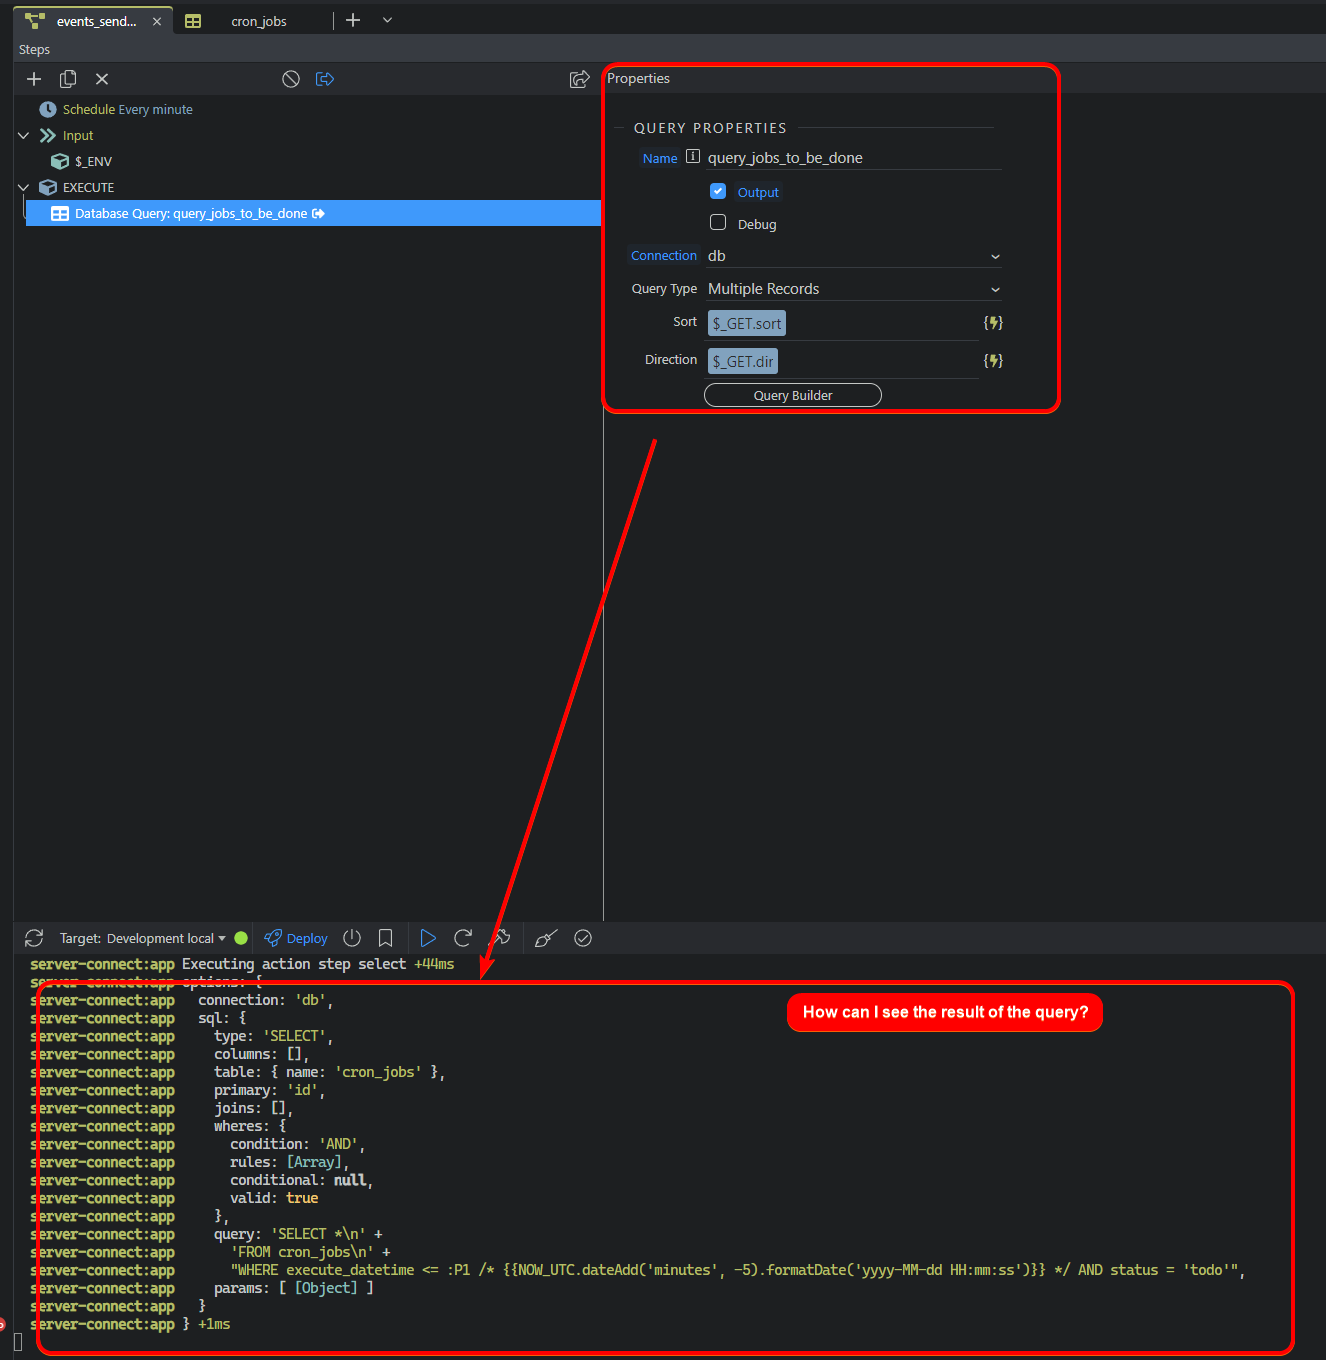
I have a cron job running every min. It queries the database.
I want to see if this query is outputting the data that I expect:
I don’t have any experience with Wappler’s cron/scheduler, yet. I have some php projects running and I have sought another solution to schedule tasks. So I don’t know the answer for your exact situation, but maybe this helps a bit:
I usually use either n8n or pm2 to schedule tasks. So for instance I would have a cron schedule running in n8n or pm2 and that send a http request to my server action that I need done per schedule. So to try this out I just use Postman to manually call the server action, before activating the cron schedule. And in Postman I can see the output in the resonse.
Thanks, that does make sense but I’m trying to not add complication by using external tools at this point. If Wapplers solution isn’t ready yet then I can look into n8n or pm2!
There must be a way to see the output of a ‘scheduled server action’ in Wappler - otherwise how can anyone use them at all, if there’s no way to test that the action works?
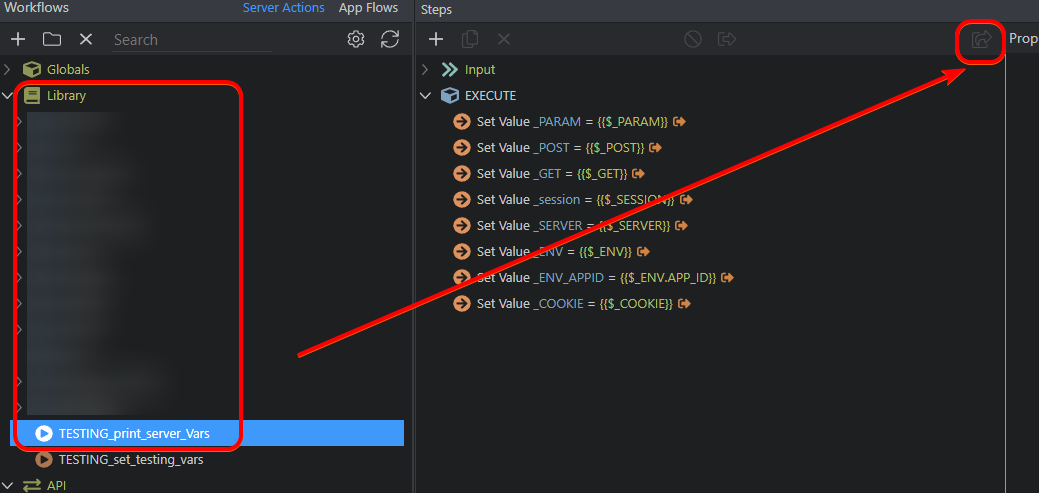
You could easily set the actual steps up as a library action file and the exec/include them on the scheduled file instead of placing the steps n the file itself.
That way you can easily test whether the steps work.
I also have some scheduled actions that insert a time to the DB with an insert ID/query field from a previous step to check that the file is running.
Ah I didn’t mean to suggest using n8n or pm2. What I meant is that you can check your response by calling a server action directly through something like Postman.