Hello everyone,
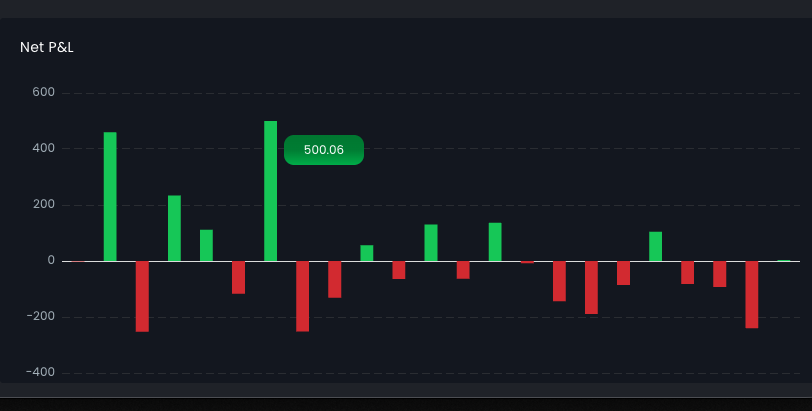
How do i create a custom chart tooltip? In my actual app i have this tooltip (image below) and i would like to replicate to wappler.
Thanks,
Rodrigo
Hello everyone,
How do i create a custom chart tooltip? In my actual app i have this tooltip (image below) and i would like to replicate to wappler.
Thanks,
Rodrigo
Which part of the tooltip do you want to customize - the appearance or the content?
The appearance. The content is basic in this case.
Here’s an updated version of the Charts script that gives you full control over tooltip appearance — using all options supported by the Chart.js tooltip configuration
Download: dmxCharts.zip (8.7 KB)
Unzip the archive and replace the files in your /dmxAppConnect/dmxCharts folder.
Then, add the following snippet before the closing </head> tag on your page:
<script>
dmx.global.set('chartsConfig', {
    options: {
        plugins: {
            tooltip: {
                backgroundColor: '#008738',
                bodyColor: '#ffffff',
                caretSize: 0
            }
        }
    }
});
</script>
in your chart element, bind the global config
dmx-bind:config="chartsConfig"
like this:
<dmx-chart id="chart1" dmx-bind:data="serverconnect1.data.query" dataset-1:value="amount" dataset-1:label="amount" dmx-bind:config="chartsConfig" ... ></dmx-chart>
This way you can pass any config option supported by the charts.js library even those not available in the Wappler UI.
Ok, thanks! Done.
But how exactly do i create the tooltip with a condition to have a red color when the value is less than 0 and green when above 0?
Then change the config to:
<script>
    dmx.global.set('chartsConfig', {
        options: {
            plugins: {
                tooltip: {
                    backgroundColor: function(context) {
                        if (context.tooltip.dataPoints && context.tooltip.dataPoints.length > 0) {
                            const value = context.tooltip.dataPoints[0].parsed.y;
                            return value > 0 ? '#22c55e' : '#ef4444';
                        }
                        return 'rgba(0, 0, 0, 0.8)';
                    },
                    bodyColor: '#ffffff',
                    caretSize: 0
                }
            }
        }
    });
</script>
My script is this:
<script>
    dmx.global.set('chartsConfig', {
    options: {
        plugins: {
            tooltip: {
                backgroundColor: function(context) {
                        if ({{chart_netpnl.data.query[0].Profit}} > 0) {
                            const value = {{chart_netpnl.data.query[0].Profit}};
                            return value > 0 ? '#22c55e' : '#ef4444';
                        }
                        return 'rgba(0, 0, 0, 0.8)';
                    },
                    bodyColor: '#ffffff',
                    caretSize: 0
            }
        }
    }
});
  </script>
My chart:
<dmx-chart id="chart1" dmx-bind:data="chart_netpnl.data.query" dataset-1:label="Profit" dataset-1:value="Profit" point-size="" multicolor="true" fill="false" points="true" type="bar" colors="colors2" label-x="''" dmx-bind:colors="chart_netpnl.data.query.values(`Profit`).map(" $value>= 0 ? '#208757' : '#ff2727' ")" height="400" width="" nogrid="true" class="style1397" dmx-bs-tooltip="" dmx-bind:config="chartsConfig" responsive="true"></dmx-chart>
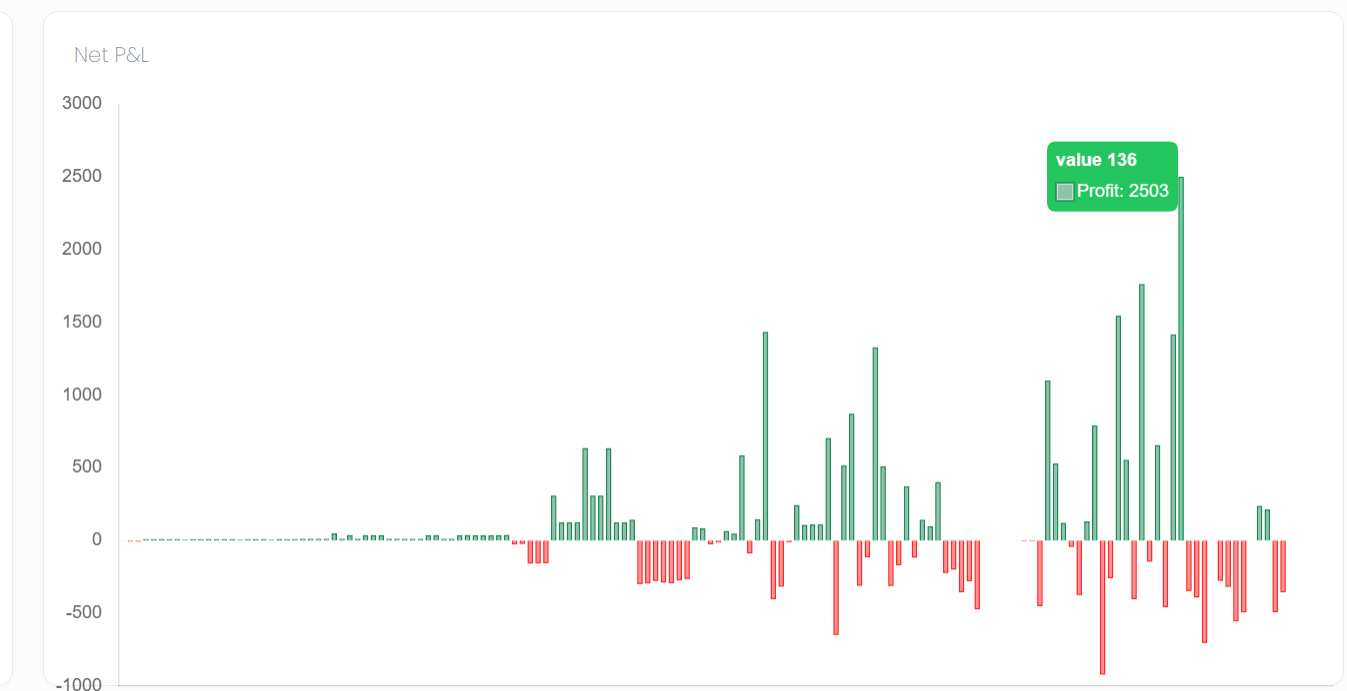
But my tooltip is still the same:
What's wrong?
Make sure you are using the file i attached to this topic and that you have cleared your browser cache, as the old js could be cached.
I've done it. Can i send a link to my page so you can check?
Just in case (https://559a9679d4ea.ngrok-free.app/dashboard)
You've edited the code i provided, please use the code exactly as i pasted it above.
Oh sorry. I tought i had to change it. Thanks. Just another quick question, how do i change the info that there's inside?
What info do you show now and what needs to be changed?
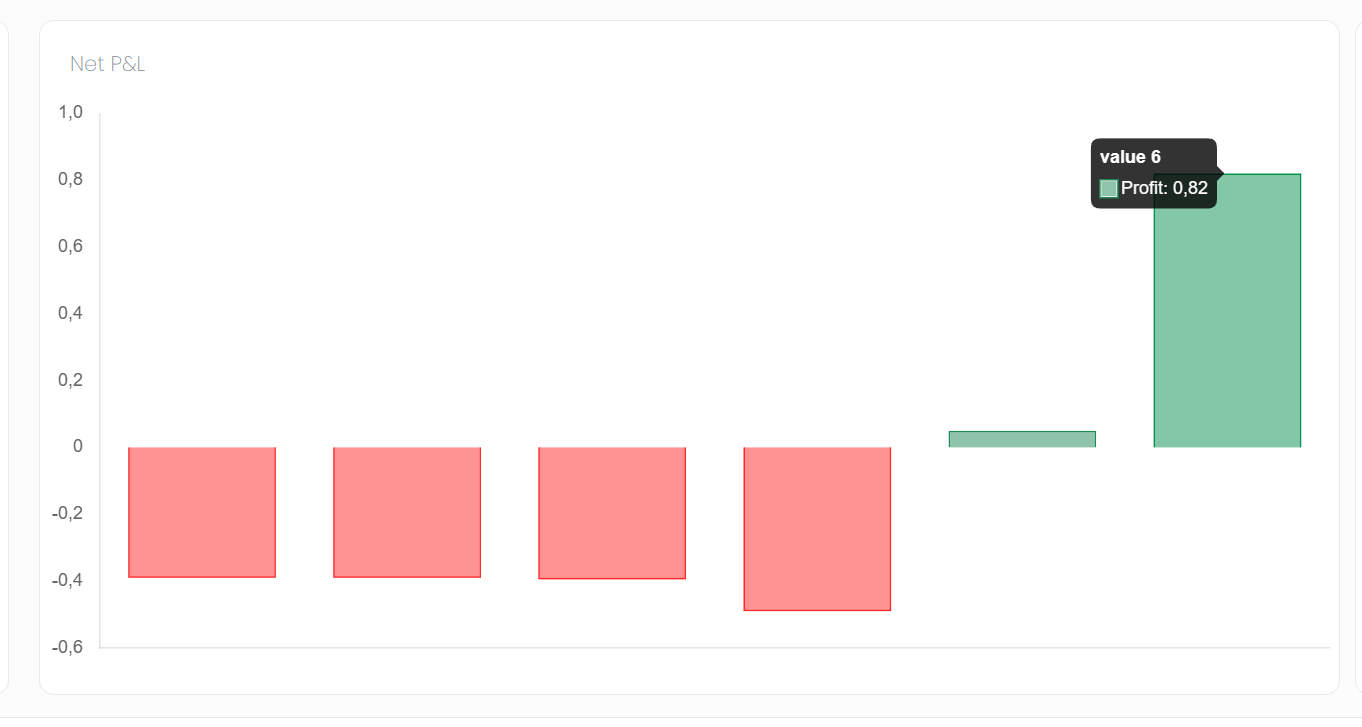
I want to remove all this information and leave only the value 'Profit' without the text 'Profit'.
I don't want the 'value 136', the green box and the profit should only show the value formated as currency. How can i do it? Thanks!
Code:
<dmx-chart id="chart1" dmx-bind:data="chart_netpnl.data.query" dataset-1:label="Profit" dataset-1:value="Profit" point-size="" multicolor="true" fill="false" points="true" type="bar" colors="colors2" label-x="''" dmx-bind:colors="chart_netpnl.data.query.values(`Profit`).map(" $value>= 0 ? '#208757' : '#ff2727' ")" height="" width="" nogrid="true" class="style1397" dmx-bind:config="chartsConfig" responsive="true"></dmx-chart>