So I would like to have 2 donut charts showing on a portal I am developing, I want it to show the amount of male and female members.
How would I get this to show with using a count() of the amount of records returned for male and female.
Tried a couple fo things but this just not seem to work for me.
So assuming your table has a field called gender which contains M or F
Try something like
select count(*) as gendercount , gender from table group by gender
This should return a list of the count of each gender and the gender designation (M/F)
How do you connect the results to the actual pie chart?
Thanks
Mik
This may help
5 Likes
How do you get more than 9 data sets? A few of our highcharts have 10 and we would like that. Any suggestions?
1 Like
Legend @Hyperbytes I forgot about Wappler Unwrapped. That has just been put as my first bookmark. I owe you a couple of beer’s next time I come over to the UK buddy.
1 Like
Actually my mistake, I forgot to upload that one to YouTube, always try to do both
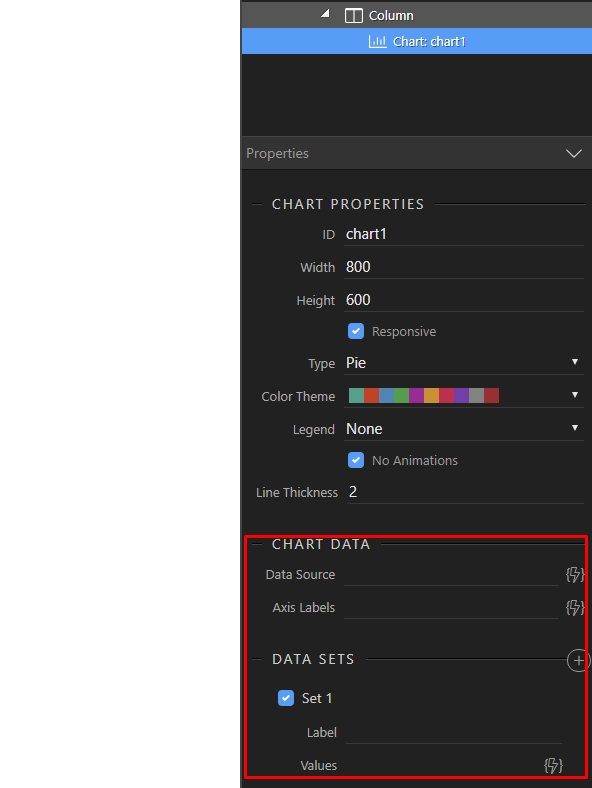
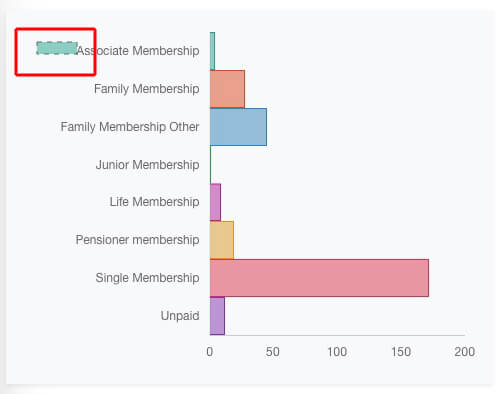
Just a question @Hyperbytes is there a way of getting rid of the ‘set’ box the one shown here…?
I can’t find anywhere to make that hidden as I don’t need it there.
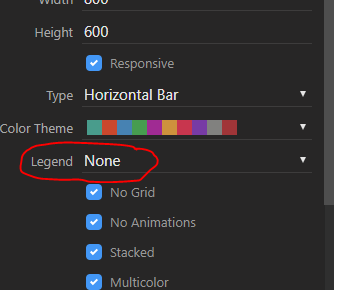
Just set Legend to none
1 Like
Sorry, @evolvedtraining, missed you comment. No, I don’t think so, it is a limitation of the component in Wappler
1 Like
Thanks Brian ,hopefully will get updated as something we use a lot.
Loving your videos, would like to use Wappler to move away from our filemakerpro database we use for capturing pro boxer data. I like the idea of an online system etc. So currently working through your videos.
If may be possible to manually add extra data sets by adding data in the format
dataset-1:label="asdcasd" dataset-1:value="rc"
But it certainly wont be editable via the GUI.
Never tired it but may work if the limit is the wappler gui rather than the actual component
1 Like
DUH…rookie mistake…thanks buddy 
1 Like