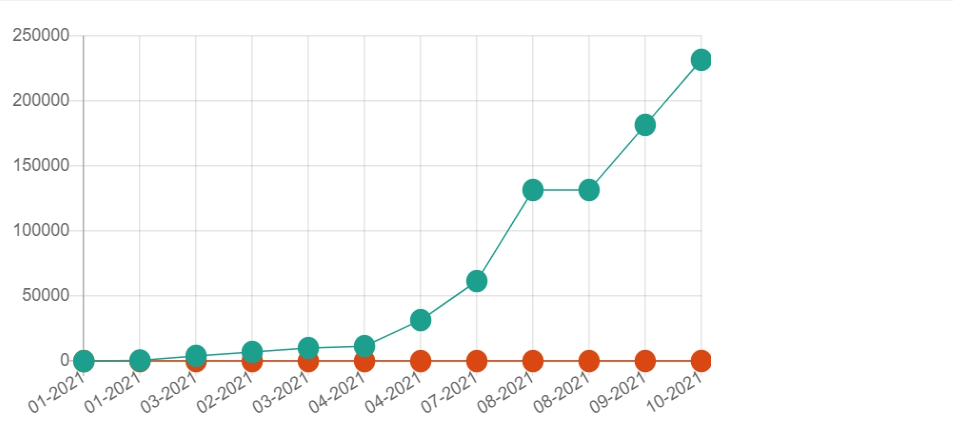
Hi All, I’m wondering how can I add a second Y-axis and scale the values, using Chart.js
the red values represent the second data set