I have a page which loads a few server connects on page load, and has a bit comprehensive UI with lots of buttons, lists, collapses etc.
Once all server actions/connects are loaded, the UI is drawn & Chrome stops showing ‘loading…’, I see in the Chrome task manager that page is using 100+ in CPU.
After a few seconds, without even doing anything on the page, it restores to 0-10 CPU usage.
Then, on click of a button, I load up a route. All ok still.
On this route, on click of an item in list, I load another server connect which binds to a list of 300+ items with 5-6 elements on each row (li).
Once this server connect is loaded and UI is drawn I can still see CPU usage at 100+ for about 40-60 seconds until it restores back to 0-10.
And this is all before I even start to interact with the new list.
I ran a performance snapshot and the results show intensive AppConnect.js use. Screenshot attached.
Can someone please help me understand what it is that I should change to optimize memory/CPU usage?
Last time I had such an issue, I used Conditional Region on suggestion of @Teodor, and it worked quite well for me. Even here, I have already placed lots of sections in conditional regions, but there’s something still taking up CPU resource.
Please help.
I had something similar when I was doing a bunch of converting to numbers and currency formatting on hundreds of elements. For me the solution was to do all that work on the server side by formatting in the sql select.
Yes, agree with that on Ken, if it can be done at server level then do it, far more efficient in terms of client load which is invariably more of a bottle neck than a database server
Thanks for the suggestion. I do keep this in mind while building out queries. But for this particular case, there are no dates or similar formatting stuff being used on client side.
I already have CRs in place… and have been using them ever since Teodor suggest some time ago. It has been a great tool to keep the performance in check.
I do have 3 checkboxes for each line items. so around 900 of them in the list that opens up in the route. Could that be it?
If you can suggest a way to check which element is causing the updates, I can try to find that.
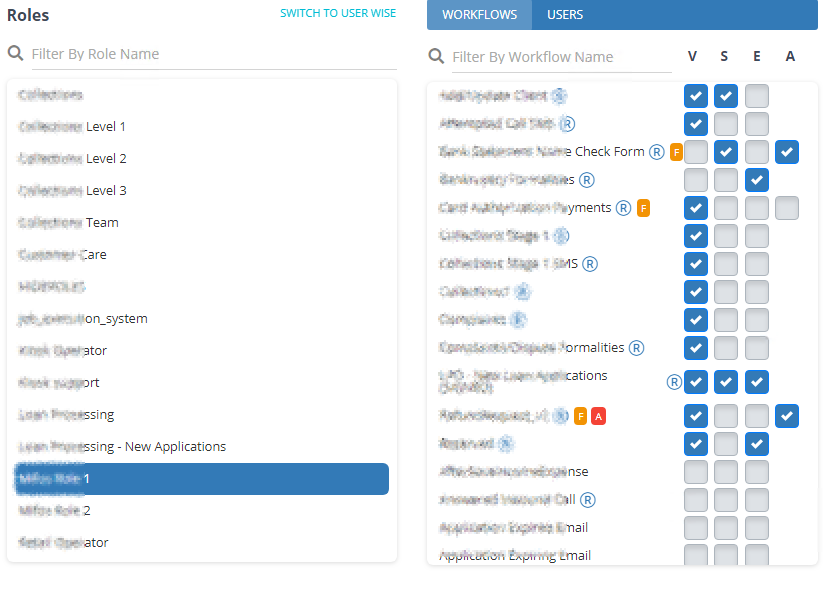
So on selection of role, 4 types of permissions can be set to each workflow item.
There is no custom JS, just some CSS to make it look like it looks.
The role list is auto-load on route navigation.
The permissions list on right gets loaded on selection of a role. There are around 200+ items here & each row has 4 checkboxes. so approx 900 checkboxes.
I am not sure what would be continuously updating though.
I created this as a new page separately, and there the performance is better, but not great.