High CPU usage on Node project with websockets

Hi. I did a project in Node
Its still on my local machine not uploaded.
I have web sockets on 3 of the server connect apis.

When i open my project my CPU usage on task manager goes to anything between 7 - 9.5 % and remains there. (High compared to other web sites I open)

Why would that be? is that because of the websockets “listening”

As I thought that once the data is loaded it should be ok… as below?

Its just a question :slight_smile: :slight_smile: :slight_smile:

Listening for data doesn’t use cpu.

Also you are just watching Chrome that does quite a lot of things in the background. Like updates, virus scanning etc.

To isolate it you should start Chrome completely fresh and if still an issue run a performance report.

1 Like

Also if you had high copy on NodeJS - you will see there the Node process and not chrome. Node is running your backend - Chrome just the front end

1 Like

Running a local docker in a Linux vm can also shred windows. Check what services are using CPU.

Found the issue… @George

I have a modal on the page.

3 Input fields with
{{(var1.datetime.addHours(2).toUTCDate()).replace(‘T’, ’ ‘).replace(’.000Z’, ‘’)}}
{{(var1.datetime.addHours(6).toUTCDate()).replace(‘T’, ’ ‘).replace(’.000Z’, ‘’)}}
{{(var1.datetime.addHours(8).toUTCDate()).replace(‘T’, ’ ‘).replace(’.000Z’, ‘’)}}

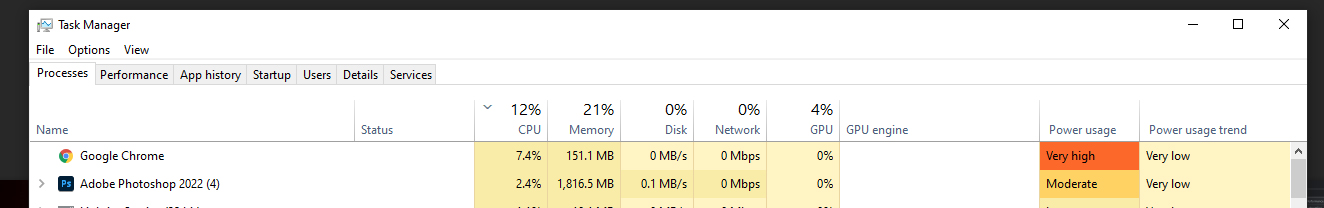
Once they are in the modal for some reason they push up the CPU processing.
Then i remove them from the modal and place them on the page itself… and its fine.
But as soon it it goes back in the modal they just push up the cpu power… weird…

Must be something im doing wrong somewhere…

But im just going to add them server side… and not bind them to the fields on the form…

I had an issue one time with a modal flickering and resetting its form as it referenced a datetime with interval=“seconds”. I changed that to hours and it was fine. Might be worth considering.

1 Like