I want to only show a chart if my data view includes at least two rows as otherwise, the line chart does not make sense with only one value.
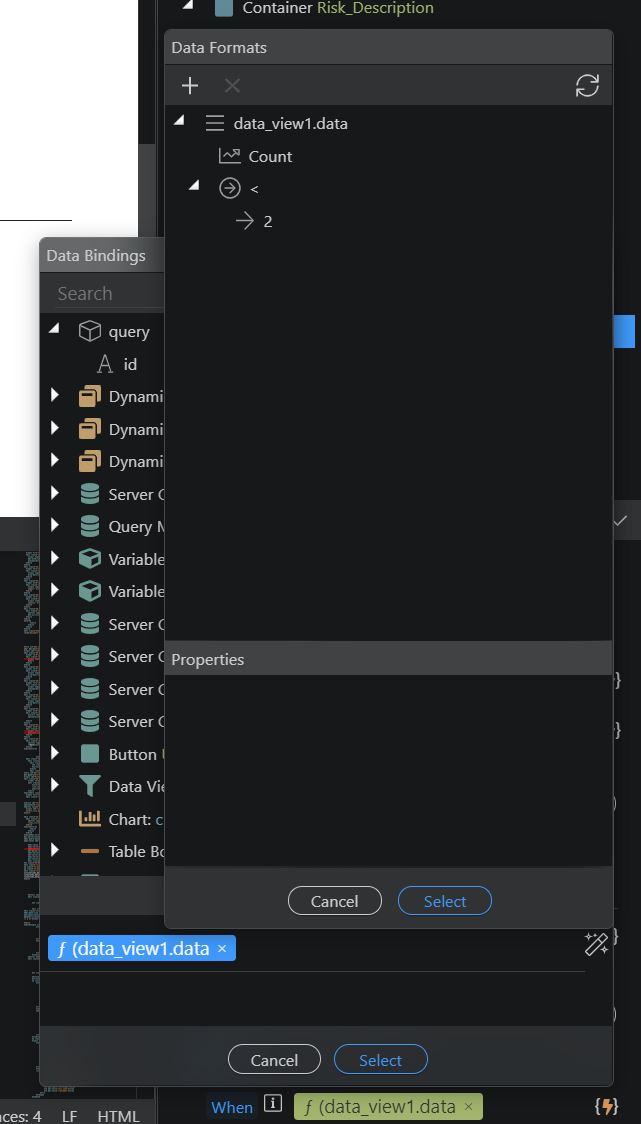
I added a dynamic attribute of hide to the chart and tried to enter the when condition as shown in the screenshot. Unfortunately, the chart is still shown when there are none or only one row in the data view. What did I do wrong?
Hi.
Can you please check the CODE tab and post what it contains?
In the above screenshot, when you close the top-most popup, the pop-up behind should have this tab at the bottom - design & code.
It could be that the picker is generating some incorrect code.
Thank you, I used the data view as the chart was showing the x-axis in the wrong order. I use dates on it so I thought the data view would be a workaround as I need the original order of the query for my repeated table. Maybe someone else has an idea.
@struppihh Just for testing purposes, are you able to display the number of items detected from your dataview?
Maybe it’s just not able to count the real number.
@ChristopheA I created a text input field and set the value to data_view1.items, and it showed the correct amount of items. I changed the name of the data_view1 to data_view_risk_score to make the name more speaking.
With some playing around, I found a solution that worked. Maybe it is not the best solution, but it is sufficient for me. I nested the chart in a display block element and added a dynamic attribute of show with the condition suggested by @mebeingken modified with the new data view name (data_view_risk_score.items > 1)
It works now fine, and the chart is showing up dynamically when a second risk score is added in the database without the requirement to reload the page.