Hello all,
How to display the values in a dynamic chart in percentage?
Thanks in advance.
Hello all,
How to display the values in a dynamic chart in percentage?
Thanks in advance.
Anyone to help here? 
I’d create a database view and pull your data via a Server Connect query to populate your chart.
Maybe you could do it in Server Connect directly, something like this:
Thanks @Dave
I am exactly thinking about your way. But how can this be done using serverconnect/query within wappler?
I'm not too sure? I try to do most of my more advanced queries in the database itself rather than use Wappler to accomplish them. Don't get me wrong I'm sure Wappler is probably capable of the above but an currently unsure of how to go about doing it.
Maybe Teodor or George could offer an insight or guide as to how you can achieve this within Wappler itself?
Hey guys, maybe if you can provide more advanced info about how the data is stored, how are you getting it, what needs to be shown in the chart we will be able to help 
Okay @Teodor, let me try to make it clear
Say that we have a table with elements like ID, Name and Number.
We have several rows and would like to represent the Name and Number in a chart.
But for “number” we want to display the percentage (number/total x 100)%, where total is the sum of ‘number’ in the table.
Hope that this is clear now.
Thanks!
Ok now i get your idea 
You can return percent values from your server actions. First add your database query, turn the output option off:
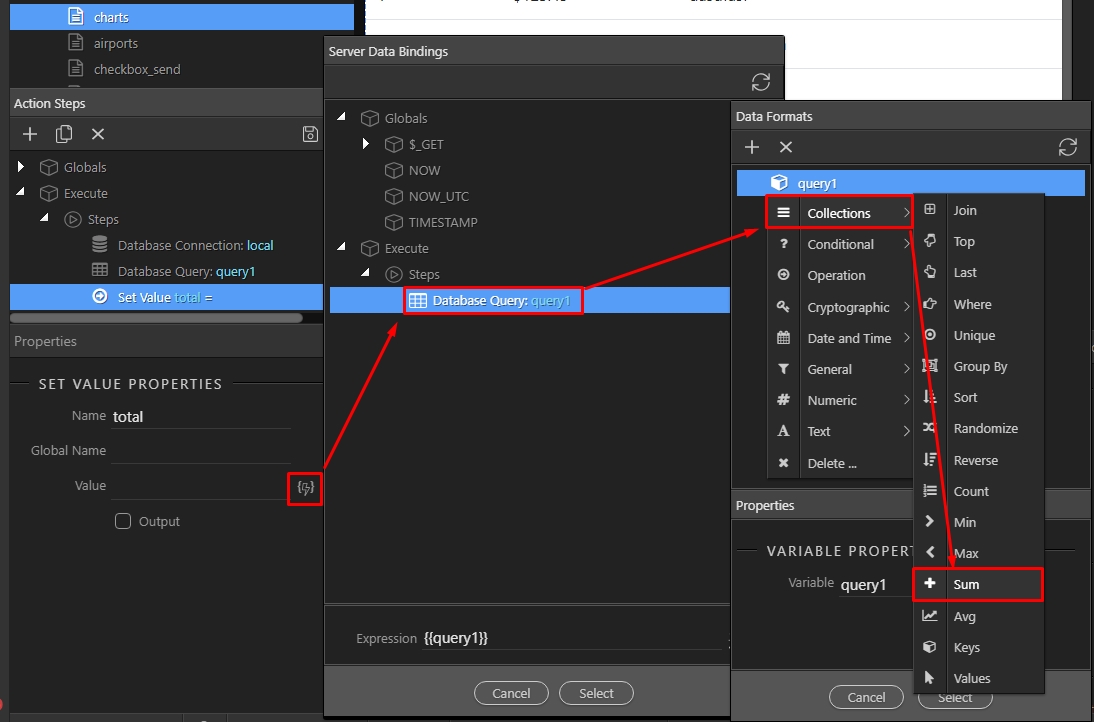
Then after the query create a setvalue step, call it total. Using the for value, select the query step, use the formatter and under collections select Sum:
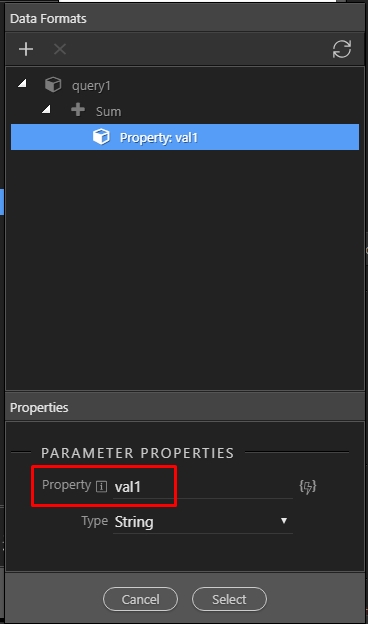
For Sum enter the name of your database column, which values you want to sum:
Now you have the total sum in a variable.
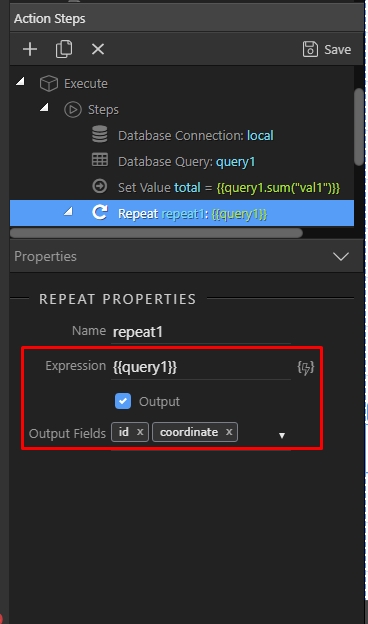
After the setvalue step add a repeat step, for its value use the database query step, and select the values which you will need in your charts as output fields. Enable the output option for the repeat step:
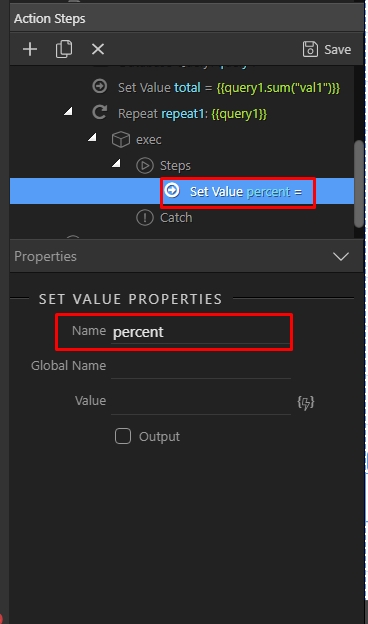
Inside the repeat steps add a setvalue step. This step will return the percent value for each row:
So for its value, according to the formula you posted, you need to enter:
{{(val1/total)*100}} where val1 is your database field and total is the name of the setvalue step we used to sum total. Enable output option for this step:
And you are done! On the front end, in the chart source you will see this value, so use it where you need it.
Great tutorial @Teodor. I have tried it and it worked perfectly as expected.
Would be great to have this added to the documentation as well 
Thanks a lot and have a great weekend!
amazing as usual! Also I understand now how to manipulate smth before output!