Hi
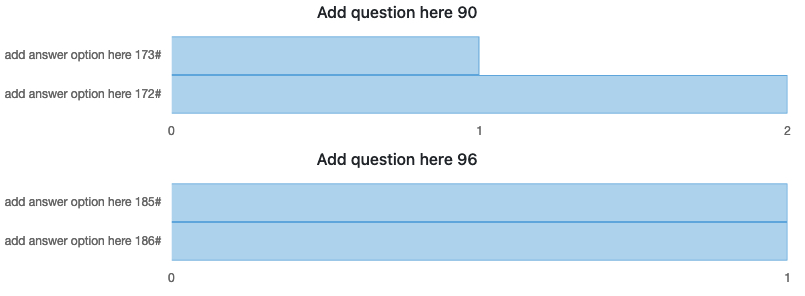
I am trying to work out how to change the chart scale on horizontal charts.
Is there a way to specify the scale interval on the axis?
Even if I have to add the option manually into the dmx chartjs file.
Thanks!
Hi
I am trying to work out how to change the chart scale on horizontal charts.
Is there a way to specify the scale interval on the axis?
Even if I have to add the option manually into the dmx chartjs file.
Thanks!
OK replying to myself as I found a solution after a bit of research but does require editing the dmxChart.js file where it specifies Horizontal bar Charts.
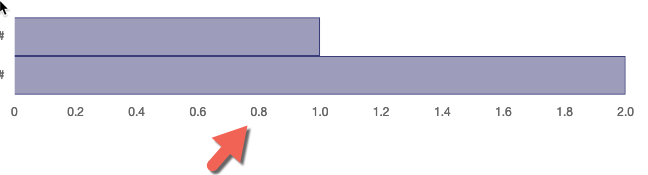
for the Ticks attribute ticks:{beginAtZero:!0, precision: 0} add the “precision: 0” to show integers.
The result is:
I haven’t used charts, but try this:
<dmx-chart id="chart1" dataset-1="" precision="0"></dmx-chart>
If it doesn’t work you’ll need to create a feature request (or change the code as above)