Different Result for Query on Server & Wappler

Hi,

On executing a query made entirely from Server Connect Database Query, the result shown in JSON is incorrect. When I run the exact same query on the database directly, the result has 18 rows. But the JSON response in Wappler has just 14 rows.

There is no way I can think of, to explain this weird difference on post. You have to see it to believe it.

Are you sure ?
Can you share your screen shot ? (Query builder and chrome debug )

Are you quite sure you’re running exactly the same query? Wappler doesn’t give us access to the query which is actually run using a Server Connect Query (it would be useful if it did). However you can access the query if you generate a query log file (eg mysql_query.log in MySQL). Then you can be in no doubt about the query which is actually executed. If you run this query directly against your database and it produces different results, that would indeed be odd.

Can you guide what and where to look for the in chrome debug?

It’s true, we cannot copy the query shown in query builder directly.
I copied the query from the database query file stored in path /dmxConnect/modules/DatabaseSources.
Hence, exact same query.

Please read all docs . Wappler have too many docs.

You dont need copy

Use this

This would not help in this case.

This is exactly what I am using. The response is a JSON with 14 rows.

The action files created using server connect store the information to generate the queries, but in JSON format. Only the main part of the query could be copy/pasted and executed. If there are any WHERE conditions etc., you won’t be able to use what appears amongst the JSON text to run a query. (But I would be happy to be wrong about this.)

From what I understand, if there are dynamic values, the query stored in the file has variables in place. In my case, I replaced the variables with static values in the query builder itself, for testing purpose. So the final query I got was executable directly on the database.

This is correct. You will have to create the query from the information in the JSON file; the actual query, as it is executed, doesn’t appear in a form which can simply be copy and pasted (unless there are no conditions etc.). As long as you create the query correctly from this informaiton, then of course the results which Wappler produces and which result from running the query directly on the database should be the same.

As I mentioned, I think the best way to debug queries is to set up a log file where you can see the actual query that is executed. Creating a query from the JSON (action files) generated by Wappler could be prone to errors; action files can run to 100s or 1000s of lines.

I looked into setting up the log file. But, unfortunately I have a shared hosting and there it does not seem possible there.
As for the query, the query I am getting from the JSON (action file) is same as shown in the query builder, so the chances of issue with the query are none.

If you’re using WAMP, then your hosting is not relevant. Here is a thread discussing this set up.

In this project, I am using a remote FTP & DB setup. This is not via WAMP.

Sorry - you mentioned WAMP in another thread and I assumed you were using it in relation to the current thread.

No worries. Actually I am trying out a bunch of things with Wappler, and have zero experience with DMX Zone & Bootstrap, hence so many issues and posts. :sweat_smile:

The JSON generated in you action will look like

{
        "name": "query3",
        "module": "dbconnector",
        "action": "select",
        "options": {
          "connection": "mysql",
          "sql": {
            "type": "SELECT",
            "columns": [],
            "table": {
              "name": "articles"
            },
            "joins": [],
            "wheres": {},
            "query": "SELECT * FROM articles",
            "params": []
          }
        },
        "output": true,
        "meta": [...],
        "outputType": "array"
      },

The query you find in the JSON is not the actual query used on your server, on your server the query is rebuild using the data in the JSON for your specific database server. The SQL query can be different depending on the used database.

To test the query you could edit the action JSON and add "test": true, inside the options for that action.

{
  "name": "query3",
  "module": "dbconnector",
  "action": "select",
  "options": {
    "test": true,
    ...

By adding the test option it will output the query in the output instead of the query result. You then open the action file in the browser and check the JSON response.

Let me know if the query generated on your server is incorrect.
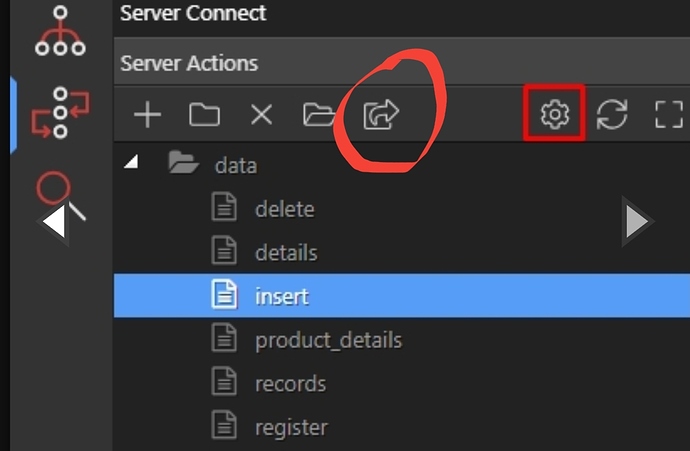
1 Like

Found the issue by using "test" : true
The query contains two WHERE conditions for two set of fields as below:
AND ((lkm.IsActive = 1 AND lkm.ToSwap = 0) OR (lkm.IsActive = 0 AND lkm.ToSwap = 1))

In JSON, the query is shown as above, along with another parameterized query with conditions as below:
AND ((lkm.IsActive = ? AND lkm.ToSwap = ?) OR (lkm.IsActive = ? AND lkm.ToSwap = ?))

And in the params section of the JSON, the values are shown as:
lkm.IsActive = 1
lkm.ToSwap = 0
which is applicable for just the first part of the condition.

For the second part, values should have been 0 and 1 respectively, but its inserting 1 and 0 again in the second part.
Hope I was able to explain the issue.

Could you also post the JSON structure of the wheres in your action file.

Do you use PHP and MySQL?