Intro
Wappler just got even better with two new tools: the Network Panel and the Live Data Panel.
The Network Panel helps you check network requests and spot errors, just like browser developer tools, but it’s built right into Wappler. The Live Data Panel lets you view and inspect real-time data and properties of your app’s components.
Both tools are fully integrated into Wappler, making debugging and working with data easier and faster.
Network Panel
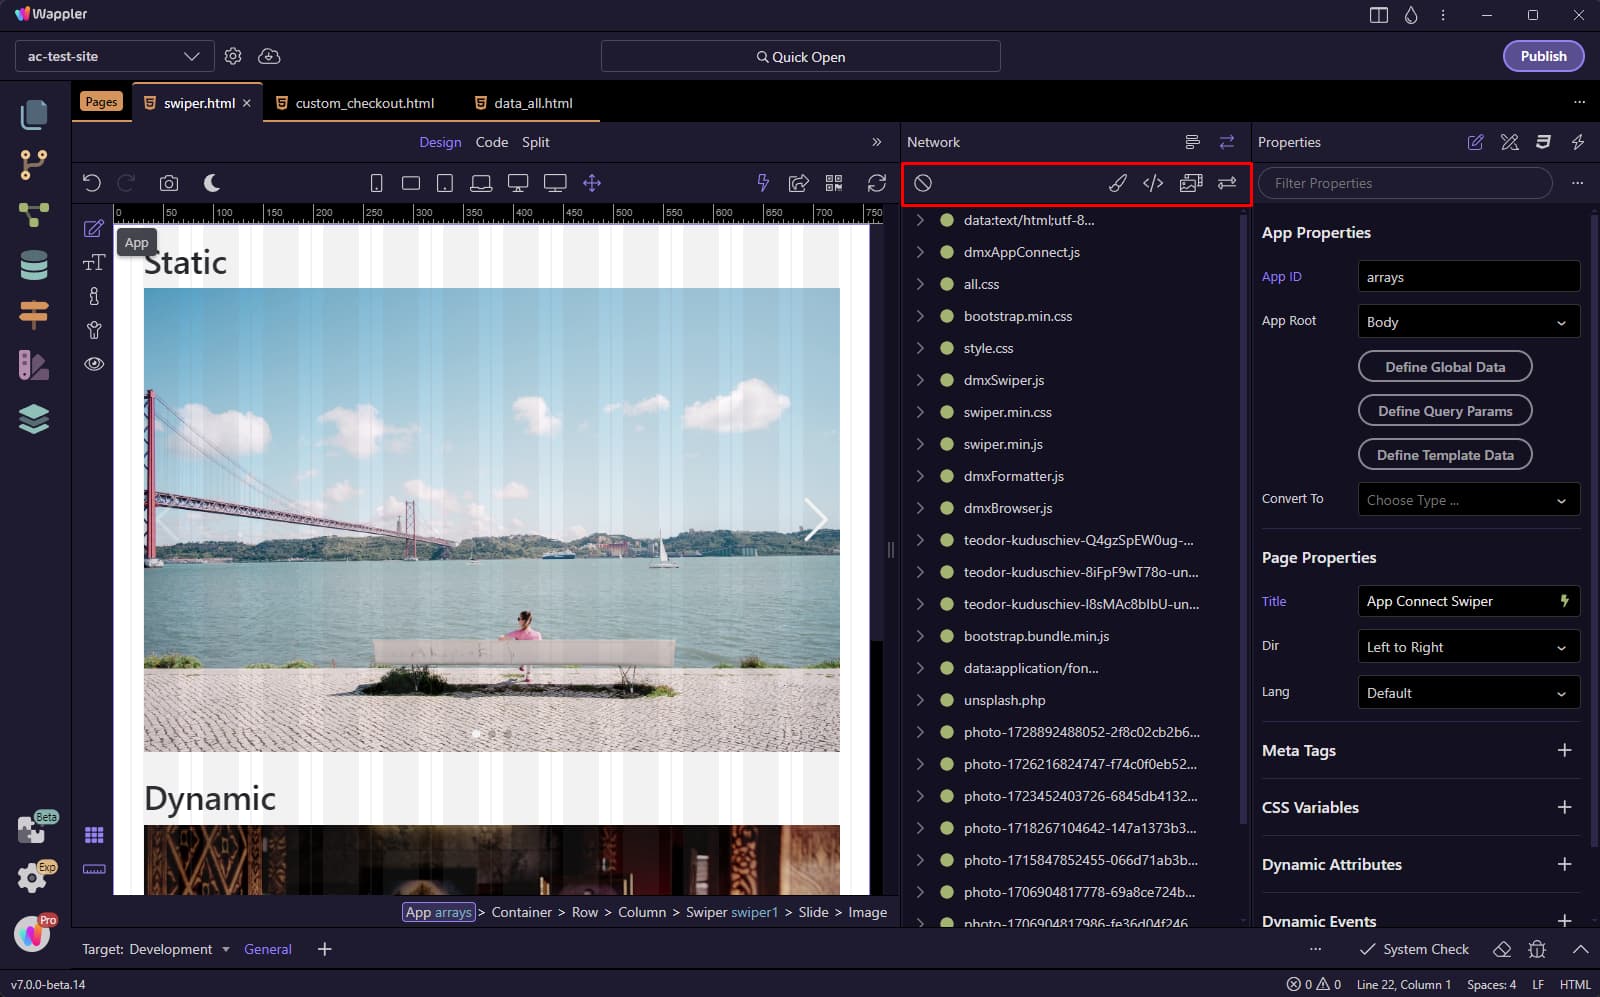
You can find the Network panel icon next to the Structure panel icon:

On the top of the Network panel you can find useful filters, which you can use to filter the requests by resource types - stylesheets, scripts, assets and XHR (Server Connect or API calls):
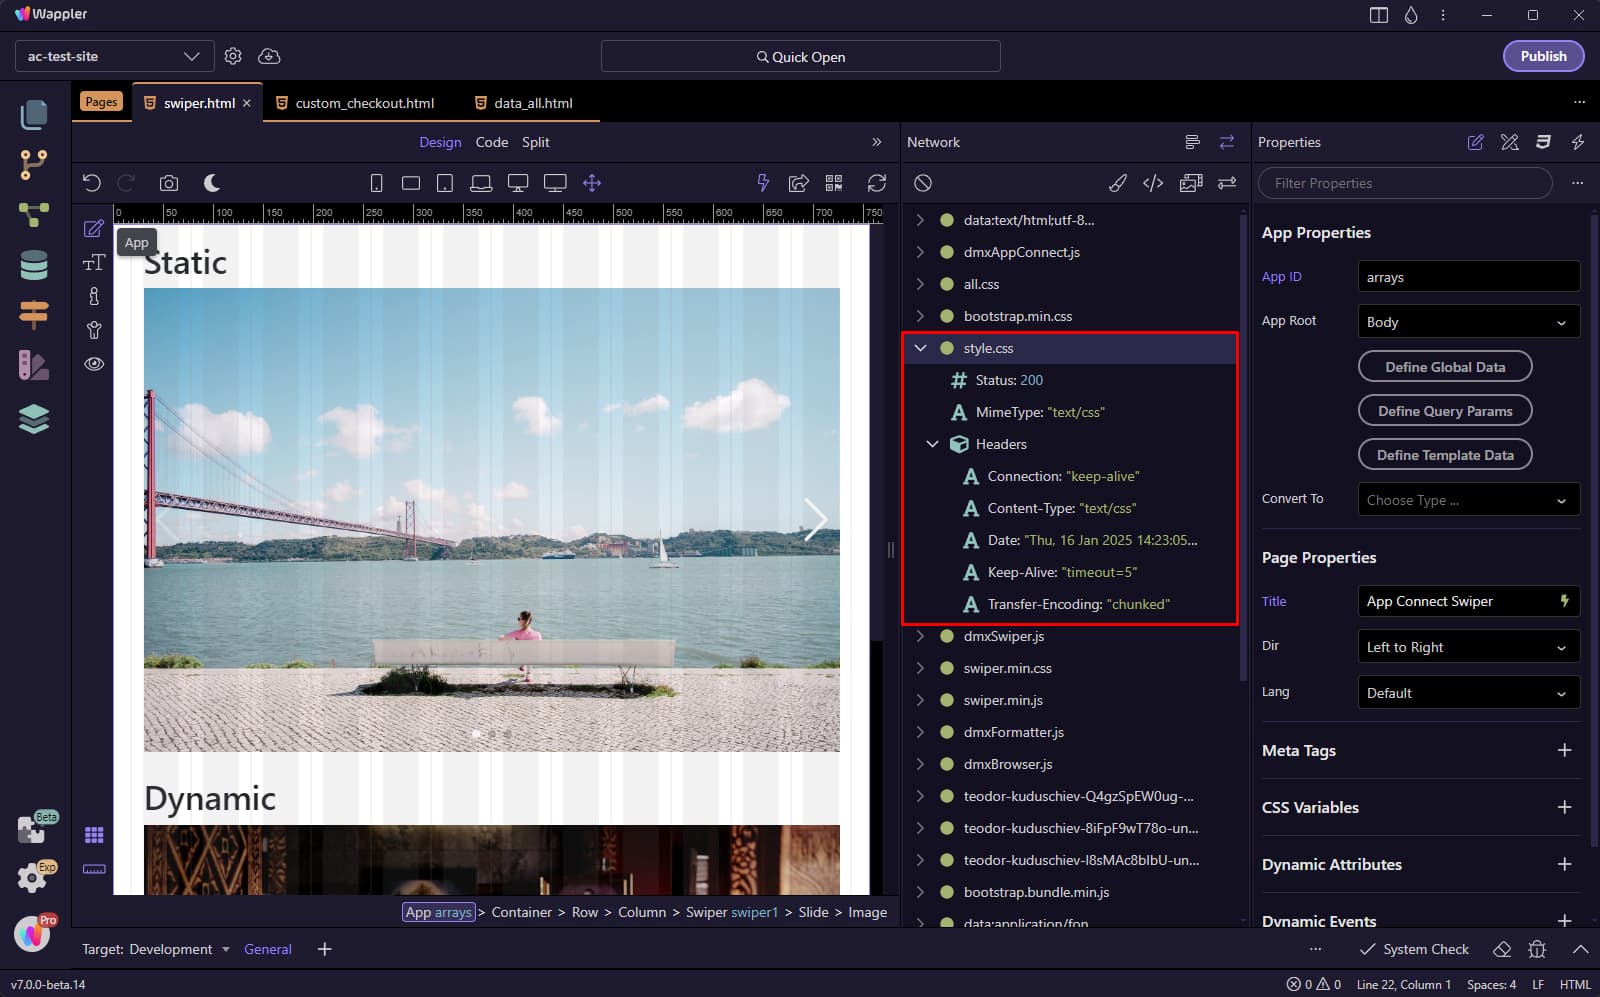
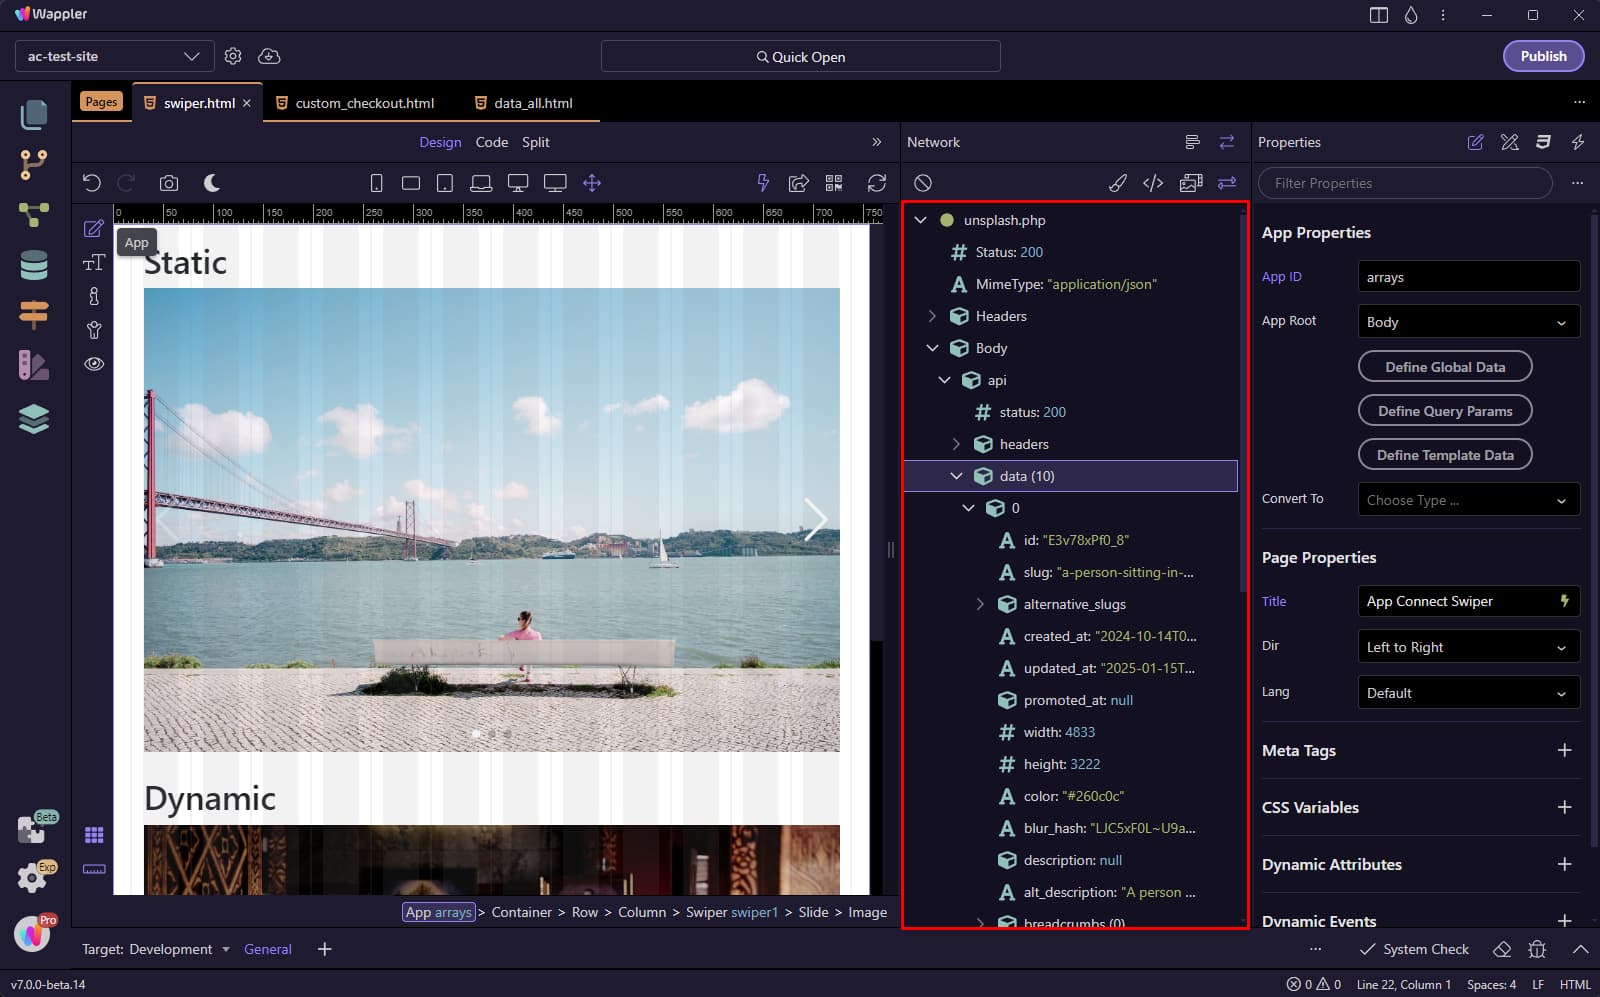
You can expand a resource to see its Status, MimeType, Headers:
If there's and error loading the resource you can easily check it:

You can filter and show just the XHR requests:
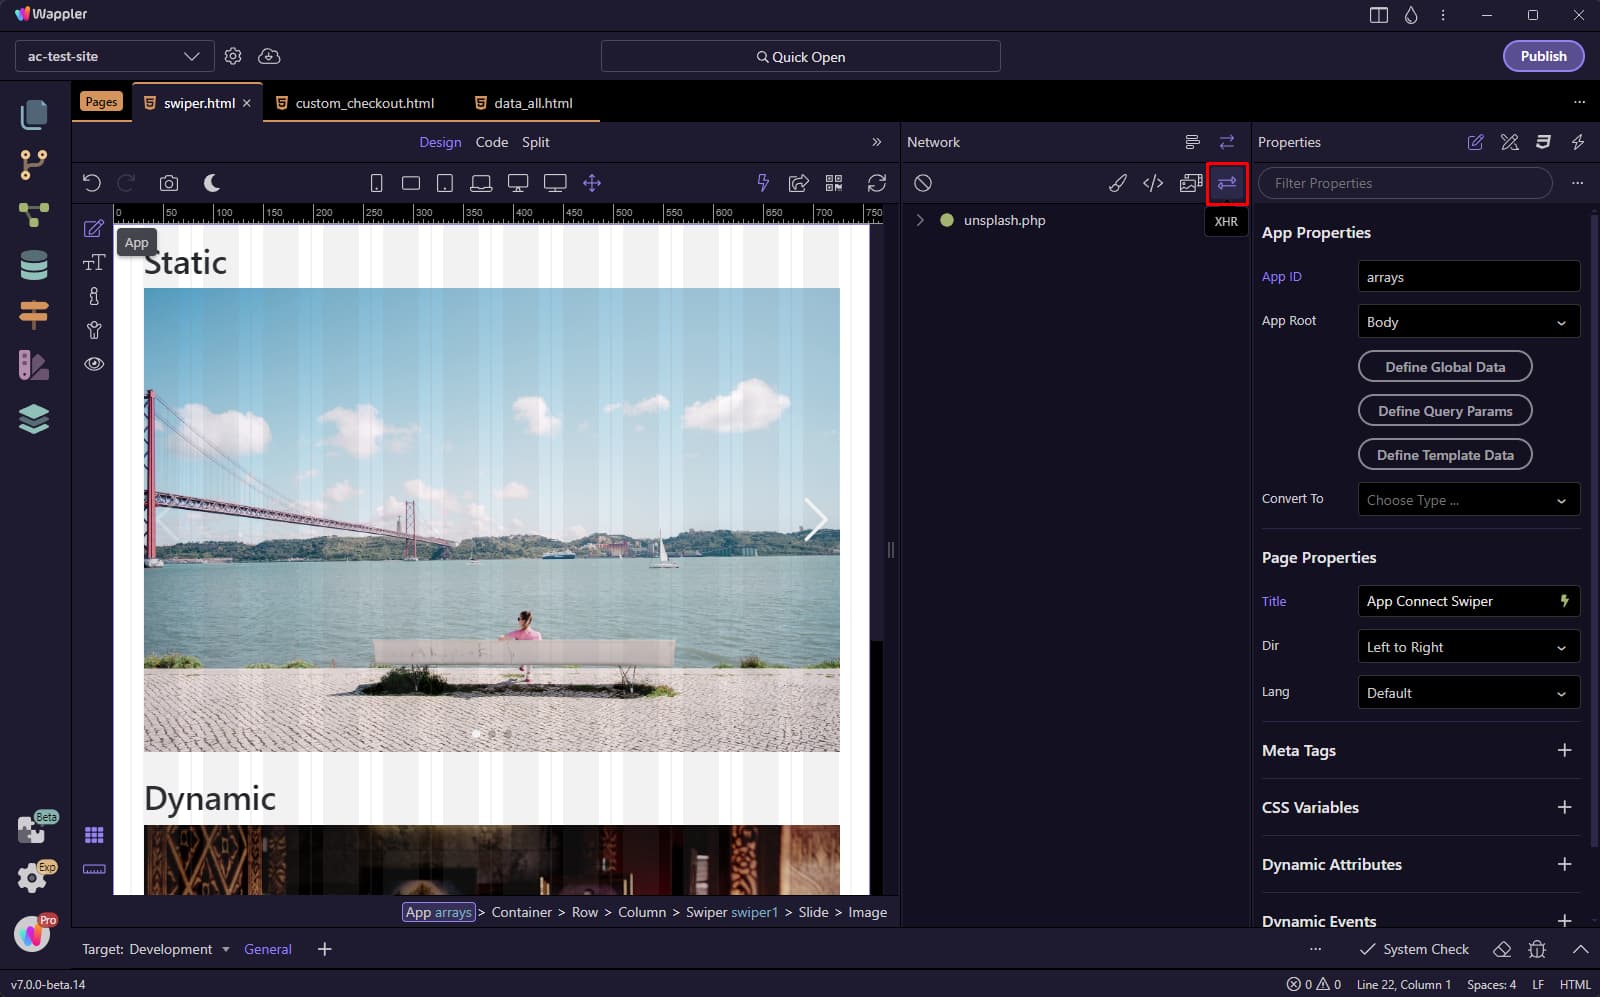
This will show you any Server Connect or API call on your page, where you can inspect its response:
Live Data Panel
The live data panel provides you with live data from the components on your page, similar to what some of Wappler users already do in the browser console using dmx.app.data
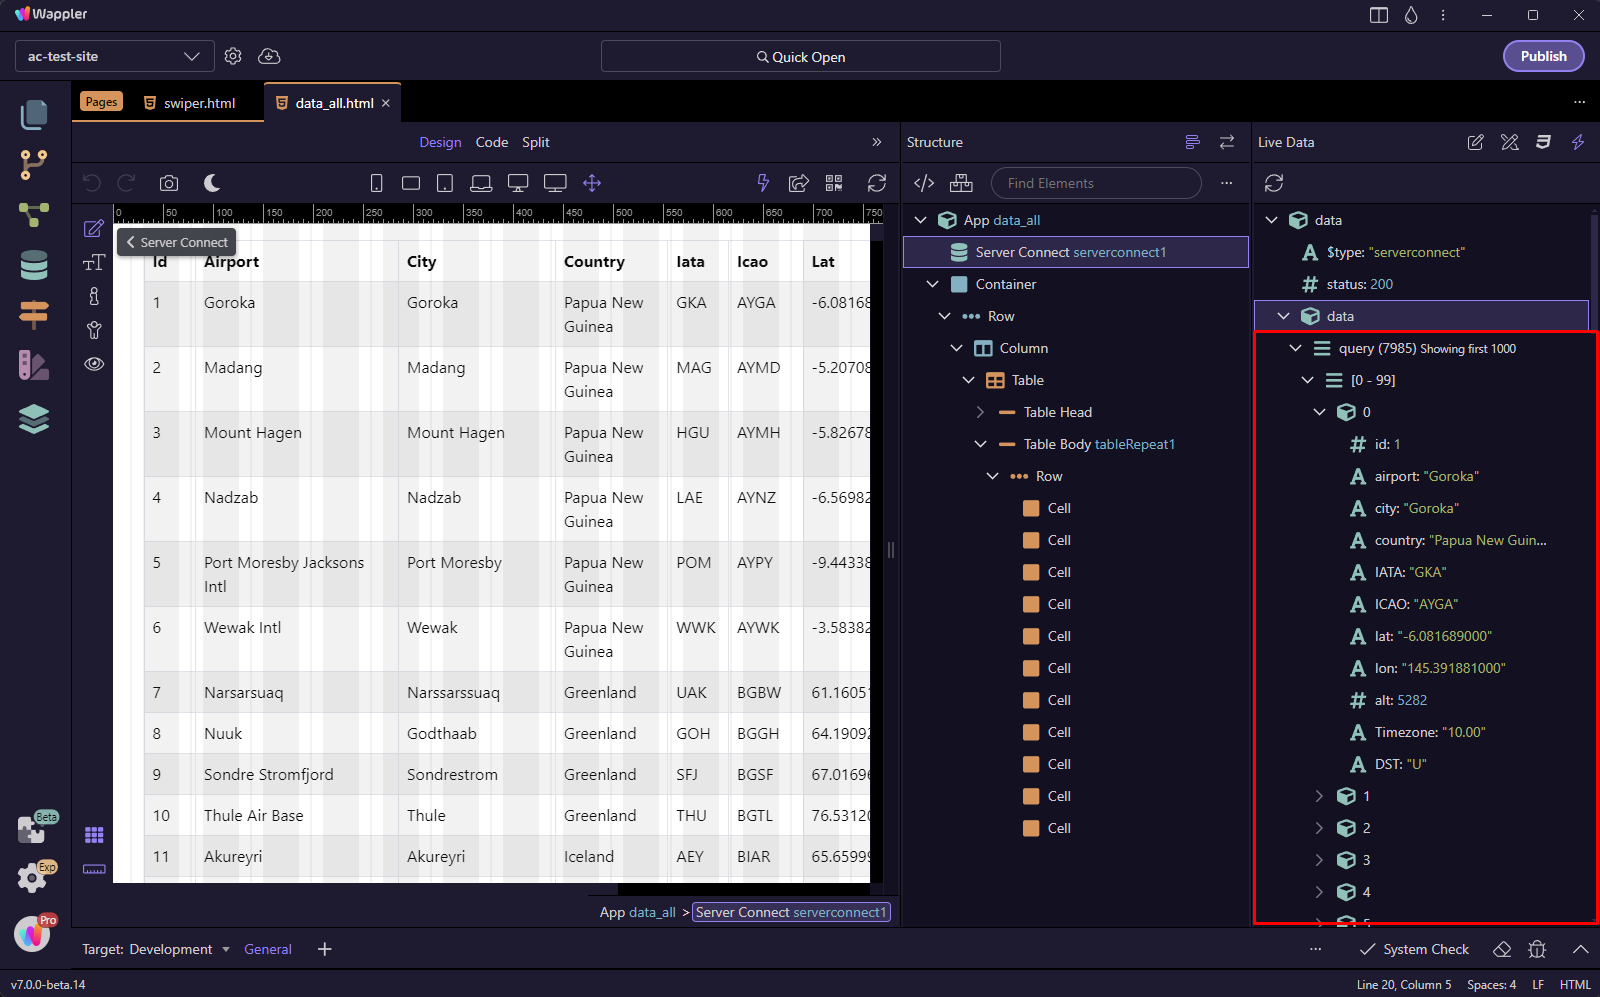
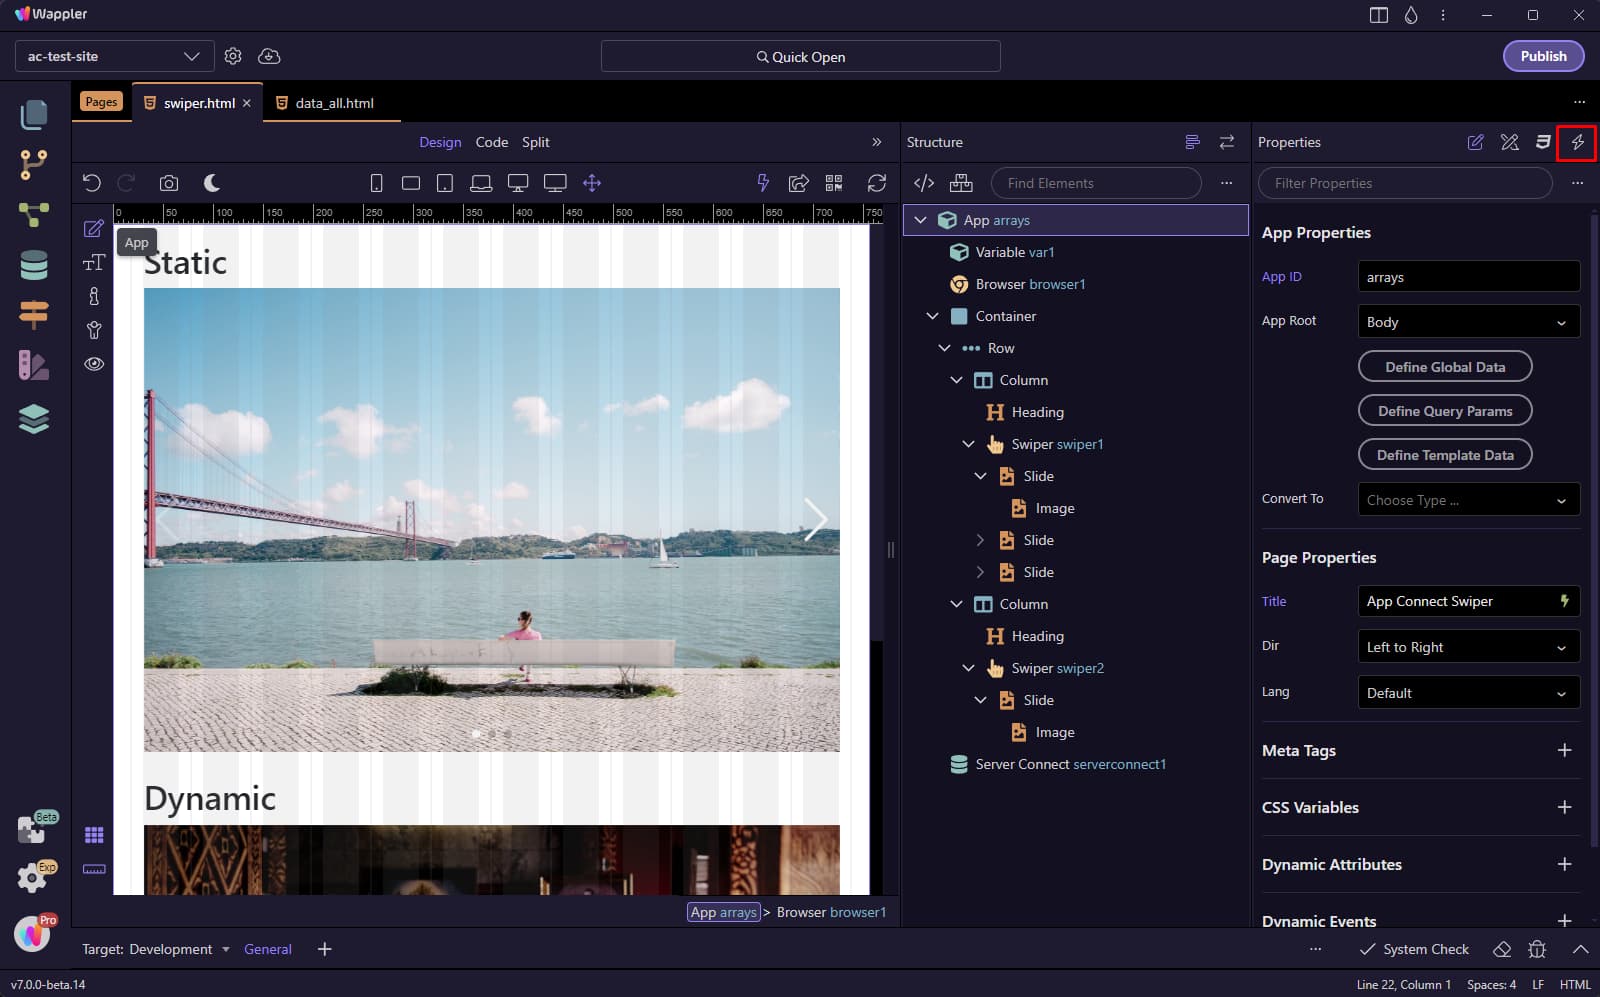
You can find the Live Data panel icon next to the Properties panel icon:
Selecting App in the App Structure panel will show all the components on your page, under data:
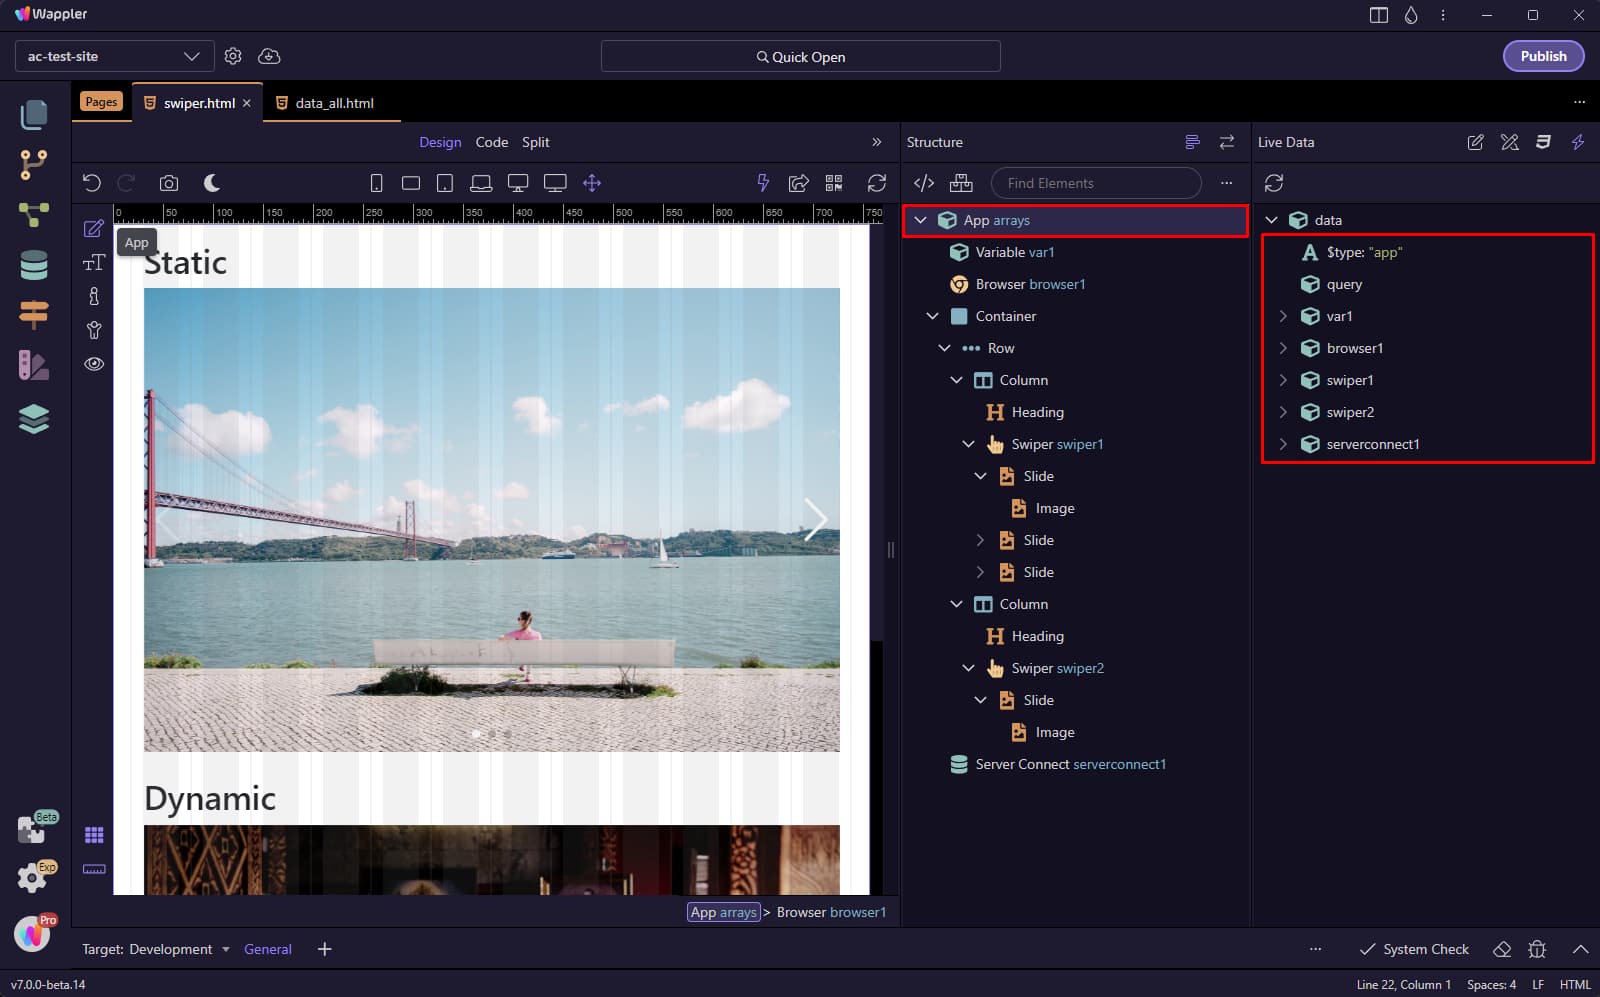
You can expand any of the components and see its data and properties:
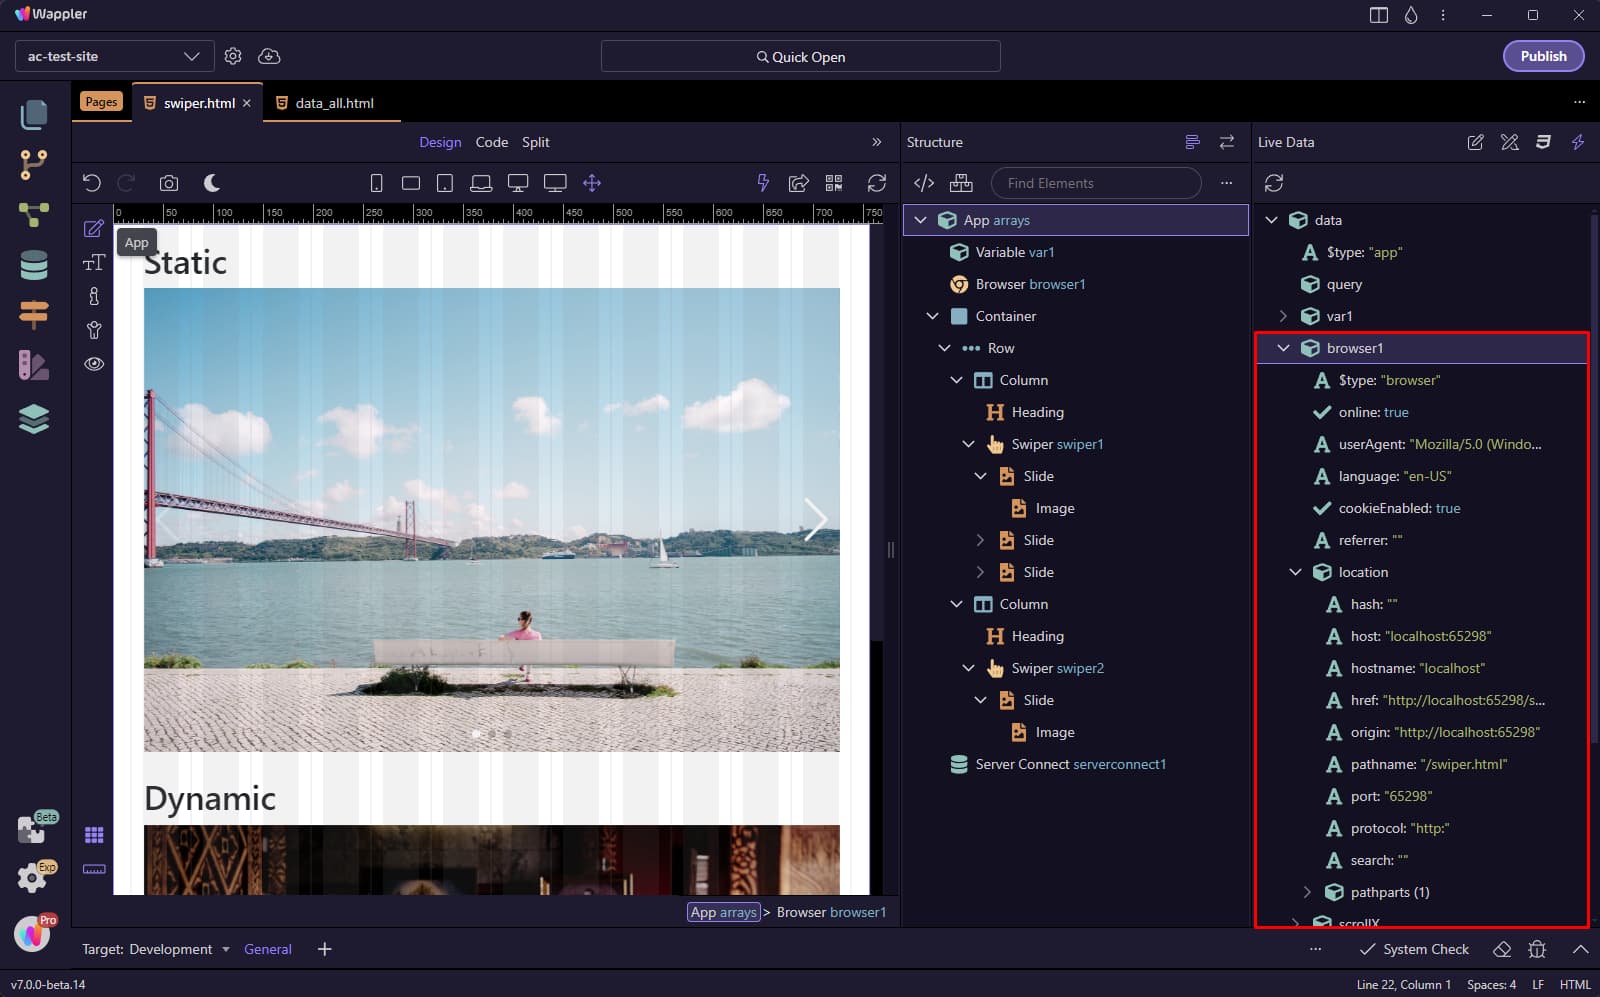
You can also select a specific component in the App Structure and you can find its data in the Live Data panel:
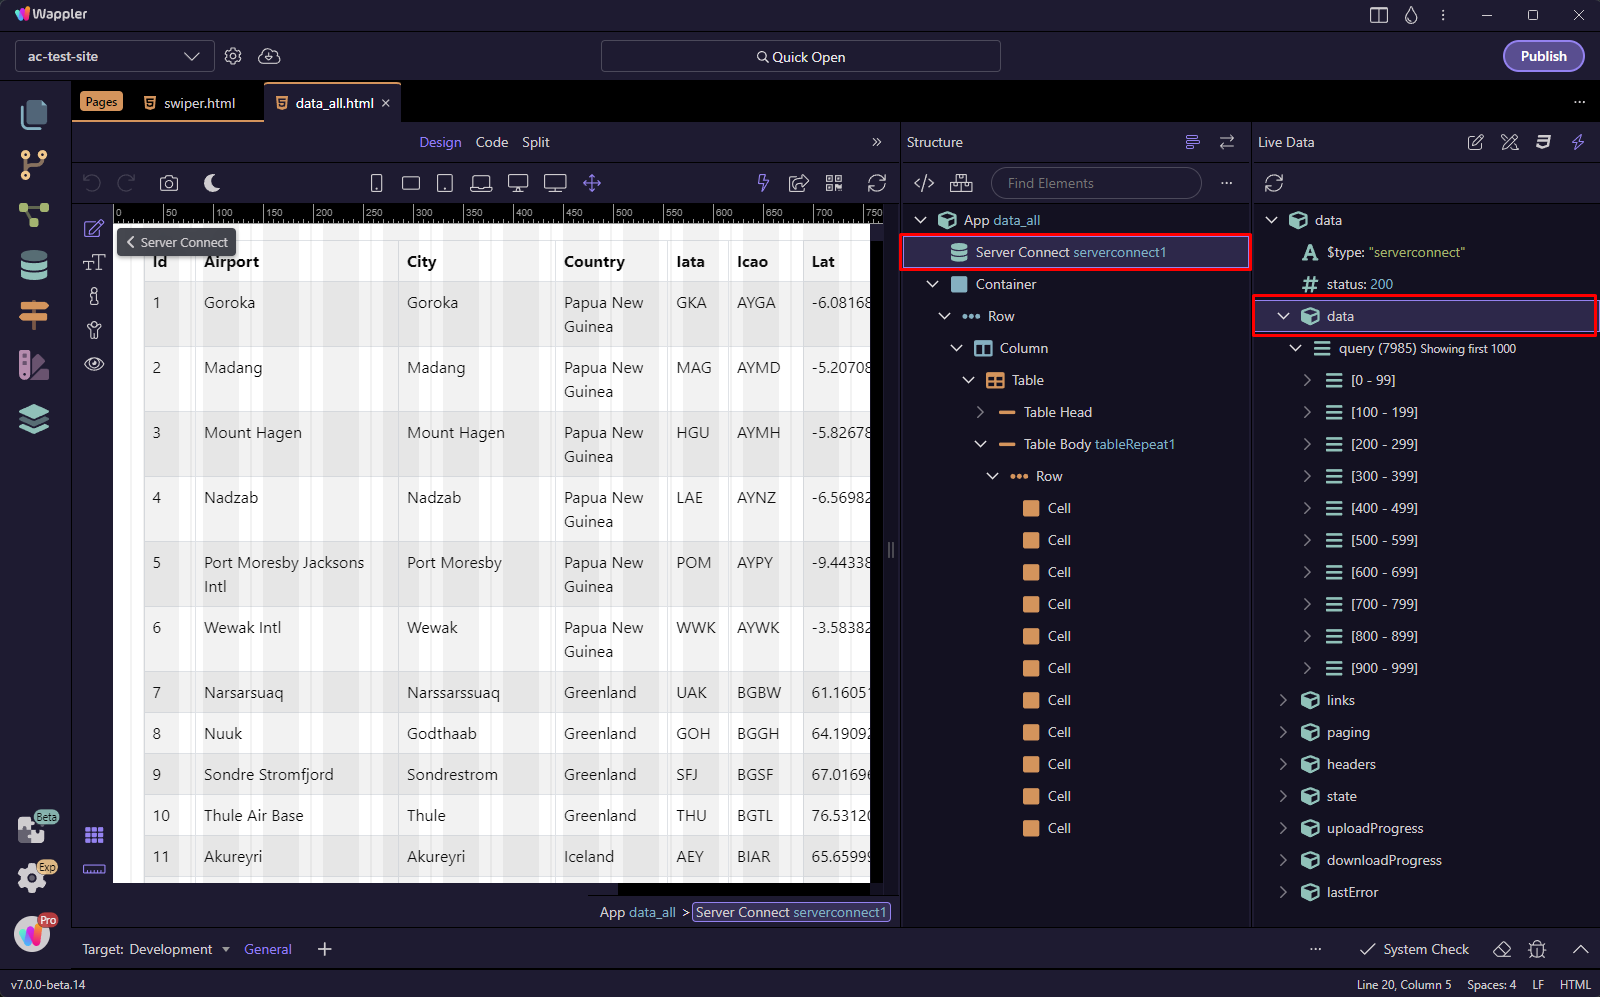
You can inspect all the data in details easily, directly in Wappler: