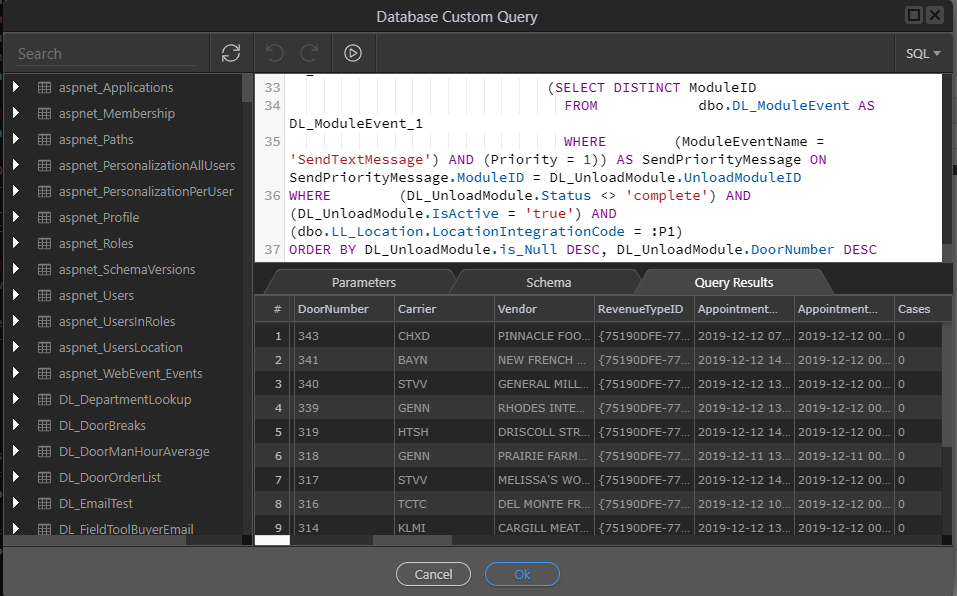
Using the custom SQL builder with MS SQL server and classic ASP, everything seems to working on that part. I can view my results here:
(it’s a large query…)
What’s up? I admit I haven’t used the custom query builder very much. I just started using it because of the current issue of not being able to display a view. Something I’m doing wrong to cause my query to output?
I’m pretty sure that is not supposed to happen. So right now, I’m dead in the water. I’ve got to finish up some pages before Christmas break, and these are some pretty big queries and I can’t use a view, and now I can’t use the custom query builder.
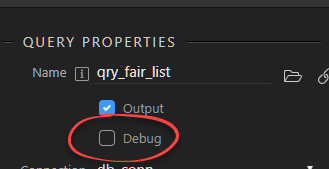
If you have Debug ticked on the custom action query, that should only be used during troubleshooting and needs to be unchecked in order to produce results.
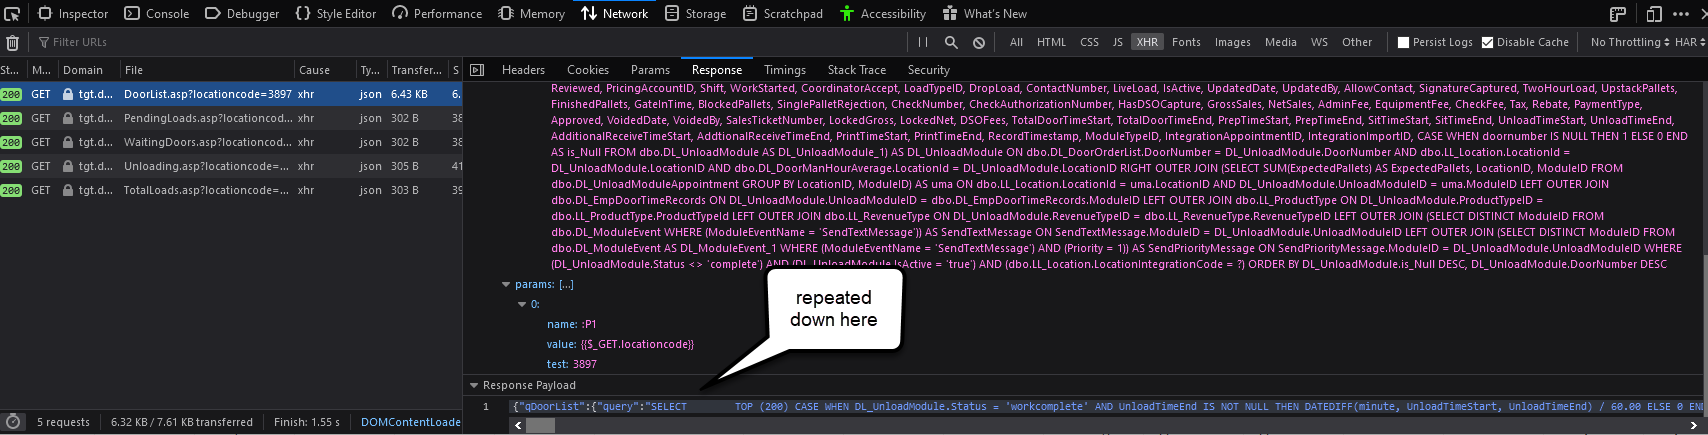
Yea, give it a shot. Debug is for looking at the output in the developer tools section of your browser. Click on “Network”, and make sure “XHR” is selected in your developer tools. It will show you your query parameters and error messages and such, but you can still see your output as long as the Output checkbox is checked. You don’t have to turn off debug to see your output.
@patrick, @Teodor, Can you guys take a look at this? I don’t understand what’s going wrong with this. I’ve got to figure out something so I can submit this to my customer.
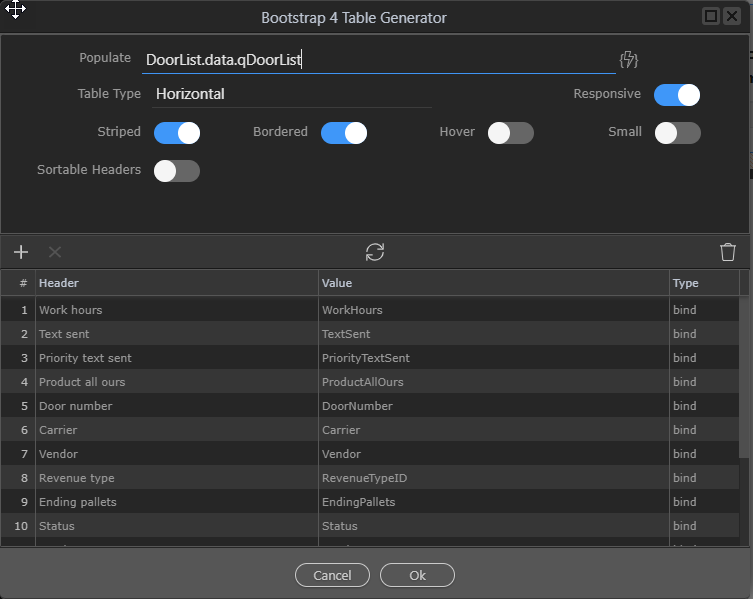
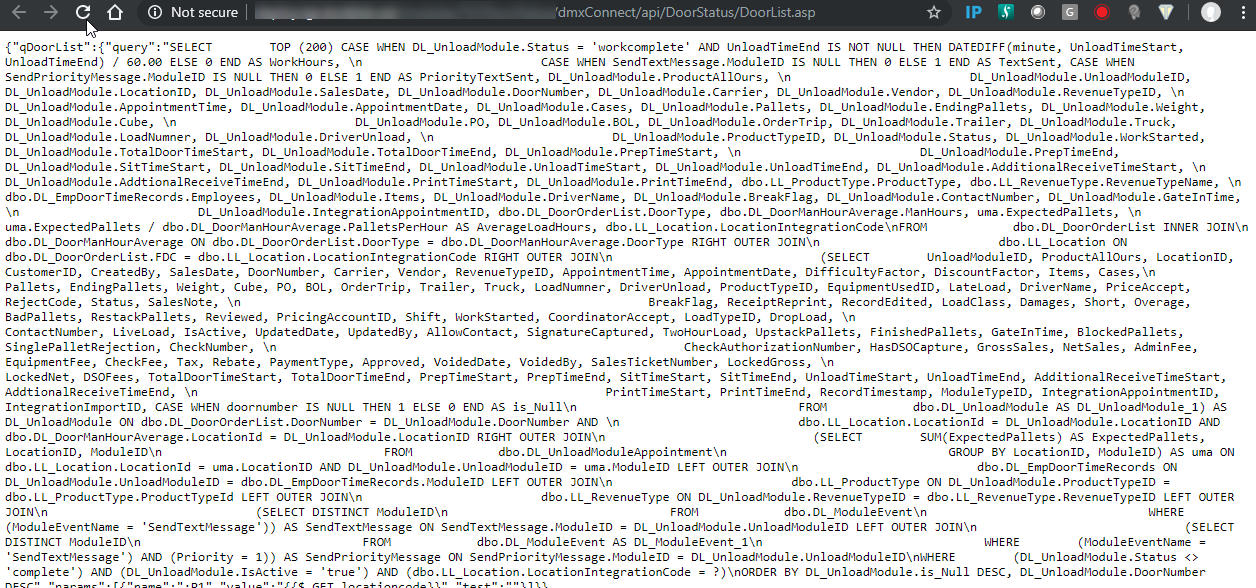
I created a custom query, click the execute button and it retrieves my data in the preview window. I save it, select it in Server connect and it outputs my query instead of the data. Does the same thing when I view my Action Step in the browser.
If I uncheck “debug” in the properties window, In the response window in my browser it says an error has occurred, to see the error, enable the DEBUG flag.
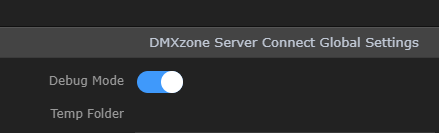
I thought the global settings was just that, you have to enable it globally for a project then turn it on/off per action step. I could be wrong though.
Well. I owe apologies. I did change it and it took a couple of refreshes but now I see my error. Sorry, just frustrated with myself trying to get it done. I appreciate everyone’s help and politely telling me i’m an idiot and not following the instructions.